
Commodities Intermediate
Assessing Technical Trends in Commodities
In order to successfully profit in the commodities markets, you will need to have some way of assessing the underlying price trends. This can seem like a daunting task for an arena as broad as the commodities space. But when we focus on the price charts themselves, there are certain visual cues present that allow us to assess where the majority of commodities traders are positioning themselves. These visual cues are the same across assets, so the signals that apply to gold will also apply to wheat, copper, and livestock.
Since these approaches in technical analysis are so versatile, it is a good idea to have at least some understanding of how trend assessment techniques work. This way, you can have a better idea of where the real commodities trends point — no matter which specific asset you are currently trading. Here, we will look at some of the ways technical analysis traders use charts to spot trend activity as it occurs.
Commodities Uptrends
In commodities markets, an uptrend is defined as a series of higher highs and and higher lows. The number of highs and lows required to establish a trend is a subject of some debate. But most chart analysis traders will generally agree that at least three higher highs and lows must be present in order to meet the definition of an uptrend. A larger series (for example, with a series of four or five highs and lows) will be viewed as a stronger trend that can be used for higher probability trading signals.
Consider the following daily chart in oil:
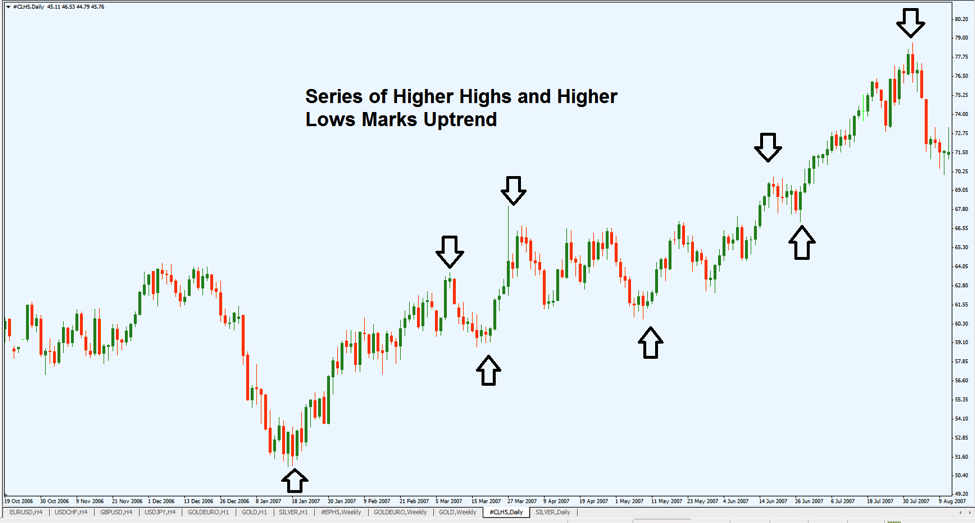
Chart Source: Metatrader
Here, we can see oil prices building in upward momentum. Prices hit lows toward the left of the chart, and then steadily move higher in a formation that builds on the downward momentum seen initially. These moves create price highs that are successively higher, and price lows that are successively higher. These price points are outlined using the arrows that follow the bullish movement.
In this example, we can see a clear series of three higher highs and three higher lows. Oil traders that spotted this signal early could have entered into long positions, based on the argument that the majority of the market was clearly buying oil. If this was done after the first three arrows, commodities traders could have ridden the momentum to profits as prices we able to propel themselves much further in the coming days.
Commodities Downtrends
A downtrend is defined as a series of lower highs and and lower lows. All of the same rules apply for commodities downtrends, only in reverse. So if we see a price trend with three price points in the series, the downtrend is considered valid. A downtrend with four price points is considered stronger than one with three points — and so on.
Next, we will look at a daily chart in silver:
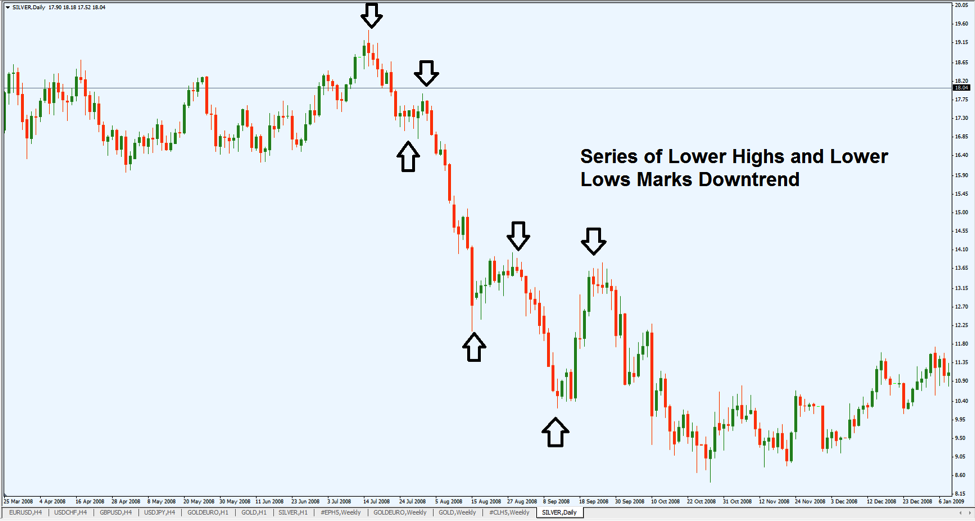
Chart Source: Metatrader
Here, we can see silver prices building in downward momentum. Prices hit highs toward the left of the chart, and then steadily move lower in a formation that builds on the original uptrend.
These moves create price highs and lows that are successively lower. These price points are outlined using the arrows that follow the bearish movement.
In this example, we can see a clear series of three lower highs and three lower lows. Silver traders that spotted this signal early could have entered into short positions, based on the argument that the majority of the market was selling silver. If this was done after the first three arrows in the series, commodities traders could have capitalized on the bearish momentum as prices we able to propel themselves much lower in the coming days.
Conclusion: Pay Attention to the Charts to Determine a Market Bias
In these ways, commodities traders are able to use price charts to identify market trends. This can be highly valuable information for those looking to establish new position in the market. Commodities trading is all about turning the probabilities back into your favor. Commodities trading is not gambling, and this is not a coin flip. If you have no method for determining whether you should be buying or selling — you will be doing no better than making a guess. At best, this will lead to trading results that win 50% of the time and lose 50% of the time. This ultimately amounts to a waste of time and this is not how commodities trading works.
Trend analysis offers a way of assessing what the majority of the market is doing at any given time. Traders that are able to “piggy-back” on this momentum are able to turn the odds back into their favor and improve their chances for success. This is especially true when this approach is used with consistency, and practiced over a long time frame. Initially, trend assessment in commodities seems like a daunting task that requires years of practice. But when these simple methods are used, trend assessment becomes much easier to visualize.
Food Commodities: Trading in Coffee, Orange Juice, Sugar and Cocoa
In a previous article, we noted some of the differences between the two main categories of commodities: the hard and soft commodities. Here, we will go a bit more in-depth and look at some of the most commonly traded food commodities. As a whole, this section of the market is relatively volatile because there are several external factors that can impact prices on a short-term basis. But volatile price swings create a greater potential for profits, as no money can be made in an asset that stands still. In this article, we will look at coffee, orange juice, cocoa, and sugar as they are situated for trading in the commodities market.
Coffee Trading
On commodities exchanges, futures contracts in coffee are equal to 37,500 pounds and are drafted in March, July, September, and December. Tick values are equal to 0.05 cents per pound. In more practical terms, this means a coffee futures contract will earn $375 for each one cent gain in the underlying price. Coffee trees can start producing beans after three to five years of growth — and every tree is capable of generating enough beans to fill one regular size coffee can each growing season. So, growing coffee is a somewhat slow process and producers are vulnerable to fluctuations in seasonal temperatures when determining yield output.
Most coffee is grown in hot climates, with Brazil, Colombia, Indonesia, and Vietnam producing most of the world’s supply. Each year, global production levels come in at approximately 120 million kilograms. Years that see lower production levels tend to see gains in the underlying price. Years that see higher production levels tend to see declines in the underlying price.
Orange Juice Trading
The typical contract size for orange juice is 15,000 pounds. This weight refers to frozen concentrated orange juice — which is much easier to transport, store, and deliver when compared to fresh orange juice. Futures contracts in orange juice are drafted in January, March, May, July, September, and November. So, there is much more flexibility in the time frames available for futures trading in orange juice when compared to coffee. Tick values in orange juice are equal to 0.05 cents per pound.
Most of the world’s orange juice is produced in the United States and Brazil — two countries with very different climate profiles. Warmer temperatures (and cheaper land values) in Brazil have led to increases in production, so it is likely we will continue to see more orange juice output in Brazil going forward. These markets are vulnerable to surprise volatility when unexpected freezes are seen in geographical locations occur in warm climates. To avoid this US producers are typically centered in Florida and California, but there are still instances where climate changes impact output levels. For these reasons, orange juice traders will need to watch weather reports in these locations in order to determine whether or not these weather changes are likely.
Cocoa Trading
Futures contracts in cocoa are defined my metric tons. If we convert to pounds, each contract is equal to 22,046 pounds (10 metric tons). These contracts are drafted in March, May, July, September, and December. Tick values in a cocoa contract are equal to $1 per metric ton, or $10 per total contract. Cocoa trees require roughly five years to produce edible cocoa, and peak production levels for each tree are seen about 10 years after planting. This is a long time to reach full production, when compared to coffee and orange juice — and this is a factor that must be considered when assessing available supply.
Cocoa is grown in tropical climates, near the earth’s equator. Ghana, Indonesia, and Cote d’Ivorie are three of the world’s largest producers, and worldwide production levels average 3 million metric tons each year. Climate in these countries is relatively stable, but the political dynamics in these locations are not. This means that internal affairs could create transportation disruptions. Other factors to watch include “black pod disease,” which is a destructive fungus that can destroy crops. Transportation disruptions or fungal incidences will generally send cocoa prices higher in the short-term.
Sugar Trading
Sugar contracts are delineated in “long tons,” with each contract equal to 50 long tons (or 112,000 pounds). Futures contracts in sugar are drafted in March, May, July, and October — and tick values are equal to 0.01 cents per pound. As a traded commodity, sugar currently finds itself in a somewhat unique position as artificial sweeteners (ie. products with a corn syrup base) have created significant competition. This will be an important issue for sugar traders in the years ahead, as there are differences in opinion on whether or not these trends will continue. Health concerns have slowed demand for products made with corn syrup, so if this continues the underlying value of sugar going again start to rise.
Most of the world’s sugar is produced in Brazil, Thailand, India, and China. Both weather and the potential for geopolitical tensions can have an impact on supply output generated in these locations. Weather disruptions for sugar are often seen when heavy rains destroy crops, and this is an issue that is usually seen in Brazil more than in the other major locations. On the positive side, sugar cane can be grown wide bands of earth — something that cannot be said for cocoa. This helps producers generate much higher yields and this helps reduce supply disruptions in sugar markets.
Gold Trading
When we look at the financial headlines, gold markets get a great deal of attention. This is not surprising given the fact that it has been traded in financial markets for thousands of years. In modern times, gold is traded by troy ounces and most of the volume travels through the New York Mercantile Exchange (NYMEX). For the most part, these trades are conducted through options or futures contracts so there is usually no physical delivery of gold bullion, coins, or jewelry. This makes gold an excellent vehicle for commodities traders to profit from changing trends in the financial market as a whole. Here, we will discuss some of the factors involved when trading gold as a commodity.
Safe Haven Assets
It is no surprise that gold has an integral part in the history of the financial markets. It has been actively traded for thousands of years in nations all over the world, never losing its intrinsic value. This is not to say that we have not seen great fluctuations in its commonly accepted price. But if there were no changes in price, it would be impossible for commodities traders to profit from it as an investment. These fluctuations are generally dependant on the broad state of the economy and the bullishness of commodities in general. But they are also dependant on the market’s willingness to accept risk. When market investors are looking for protection from widespread uncertainty in the market, gold tends to benefit as a traded commodity.
For these reasons, gold is often thought of as the original safe haven asset. Whenever there is turmoil in stock markets or in the global economy, valuations in gold tend to rise. This is why gold rallied heavily after the stock market collapse of 2008.
Consider the following chart in the S&P 500:
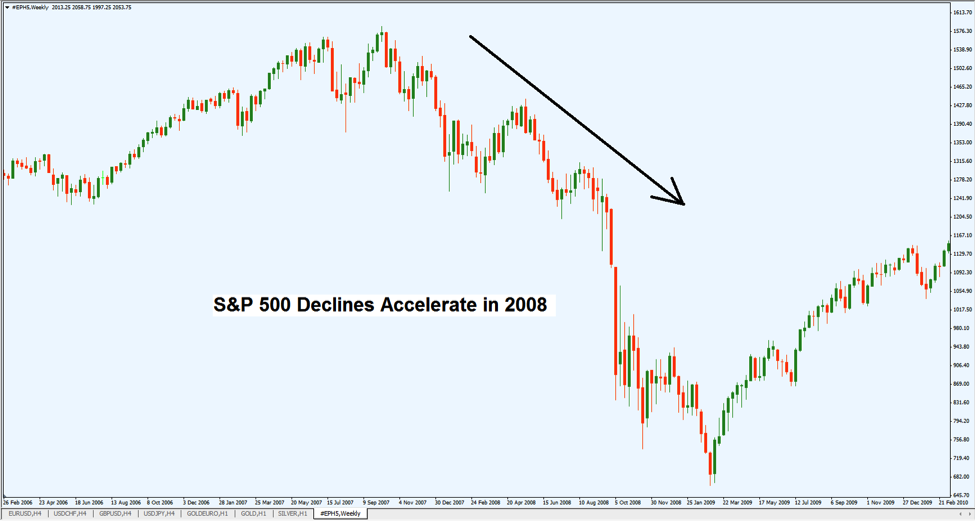
Chart Source: Metatrader
In the chart above, we can see that stocks hit a peak in 2007 before declines start to accelerate in 2008. Let’s now compare this activity to what happened in gold markets in the chart below:
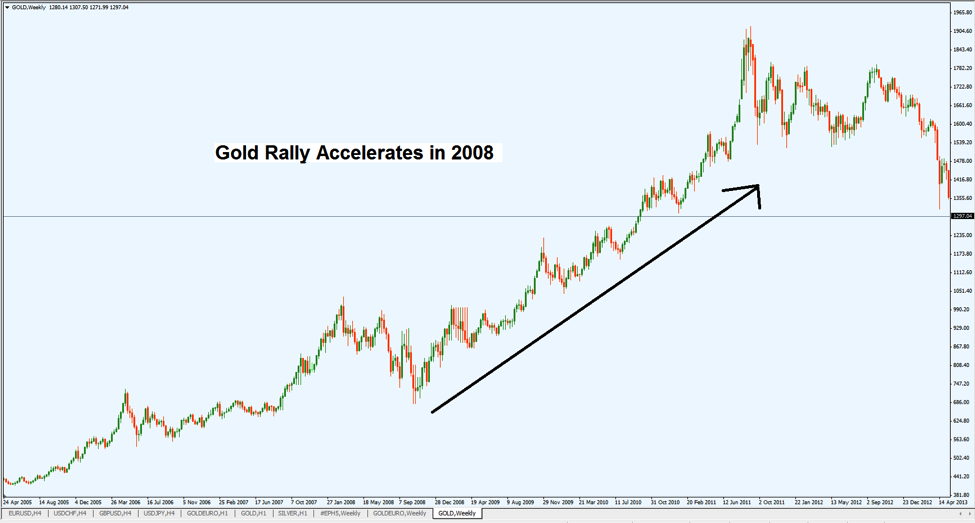
Chart Source: Metatrader
Looking at this price activity, what conclusions can be drawn? Here, we can see that gold is starting to rally around 2005 — but that this bullish move really starts to pick up in 2008. Since this is the same time stocks started to decline, we can assume that gold and stock markets share an inversely correlated relationship. When one market rallies, the other tends to fall — and vice versa.
In other words, when stocks and the global economy were in complete disarray, commodities investors moved into gold in order to capitalize on the safe haven properties it typically possesses. This is very useful information for commodities investors, as it becomes much easier to spot trends as they are developing. If a trader had noticed that the S&P 500 was collapsing in 2008, long positions could have been taken in gold until it hit its all-time high in 2011. A trade like this could have resulted in significant profits, with very little risk at any given time.
Gold as a Hedge Against Inflation
Another factor for commodities investors that are looking to trade in gold is inflation. Gold is also used as a hedge against currency inflation, and this is something that can be useful in determining precious metals trends. For example, gold was only trading for a couple hundred Dollars an ounce in the 1980s. Inflation was very low during this period, so there was not much need for investors to protect their nest egg by moving out of cash assets. As inflation started to pick up in 2005, so did the price of gold.
It should be remembered that even currencies have a value that rises and falls relative to the rest of the market. When inflationary pressures are growing, the value of the currency is falling. As this occurs, commodities investors will generally move into gold and precious metals as a means for avoiding these declines in cash assets. So if you have a negative outlook in world currencies, it might be a good idea to consider taking a long position in gold — either through an index fund, options, or using a futures contract. If your outlook in world currencies is positive, it would make more sense to build short exposure in gold-related assets.
The Bottom Line
Gold holds an undeniable position as one of the most important commodities in the world. This is why it gets so much attention in the financial media, and this is why it is such a popular trading tool for commodities investors. But if you are going to take the plunge and start building real money positions in gold you will need to have a firm understanding of the market events and trends that tend to change its value. Here, we looked at gold as a safe haven asset and as a hedge against inflation. These are clear factors that can impact whether gold will be rising or falling in the future.
Grains and Livestock Trading
Food is obviously an indispensable part of our daily lives — and this means that the financial markets associated with these assets are critically important to the economy as a whole. Every time you walk into the supermarket, there are slight differences in the price of the items you regularly buy. Individually, these differences might seem trivial. But for the food producers themselves, these price changes are magnified by much larger volumes. This means that there are significant profits to be made when investing in assets like grains and livestock. Here, we will look at some of the specifics seen when trading corn, soybeans, wheat, and livestock in the commodities market.
Corn Trading
Corn is traded in futures contracts equal to 5,000 bushels. These contracts are drafted in March, May, July, September, and December — and trade with tick values equal to 0.25 cents per bushel. In Dollar terms, this means that tick values are equal to $12.50 for each contract. Most of the world’s corn is produced in the United States, where output levels typically average 10 to 12 billion bushels annually.
Almost all of this output is generated during the harvest months, which occur in October and November. This is a very predictable time frame when we look at the soft commodities space as a whole but it should be remembered that corn markets are still susceptible to the surprise weather changes that influence all crops. But the time frame limitations and the lack of geopolitical uncertainty in the United States make corn trading one of the most predictable strategies in soft commodities investing. For these reasons, corn futures are often sought out by traders with a more conservative strategy outlook.
On the demand side, corn is used in a wide variety of markets. It can be eaten in its raw form as a food product, it can be used as an additive ingredient for other foods (ie. corn syrup), and it can be used as an energy fuel (ie. ethanol). Because of this, demand for corn is generally very strong as each of these markets ensure that corn is needed in consumer markets every month during the year.
Wheat Trading
Like corn, wheat is also traded in futures contracts equal to 5,000 bushels. Contracts are drafted in March, May, July, September and December with tick values equal to 0.25 cents per bushel. Most of the world’s wheat supply is produced in the United States — and there are three different types of wheat that are grown. Spring Wheat is traded on the Minneapolis Grain Exchange (MGE), Red Winter Wheat is traded on the Kansas City Board of Trade (KCBOT), and Soft Red Winter Wheat is traded on the Chicago Board of Trade (CBOT).
Wheat futures are vulnerable to fluctuations in weather, and it is possibly to see very different prices at different times of the year. For these reasons, it is advisable for new traders to buy and sell in small positions during the first year in order to get a better sense of where the commodity trades during each month. Prices are generally lower in January, and higher in August. So it is usually a better to establish long positions earlier in the year. Wheat is used in many different industries — in everything from livestock feed to brewing companies. This diversity in use generally supports prices throughout the year.
Soybean Trading
Soybeans are traded in 5,000 bushel contracts, which are drafted in January, March, May, July, August, September, and November. Tick values in these contracts are equal to 0.25 cents per bushel (just like wheat and corn). Most of the world’s soybean production occurs in the United States, and is used as an oil and as an additive to many foods. Weather disruptions are usually seen during the summer months, so commodities investors should expect heightened price volatility in the July and August contracts.
Soybeans are less commonly traded than corn and wheat, so there have been examples of over-inflated pricing in some futures contracts. For these reasons, it is a good idea to avoid using real money in trading soybeans until you have some experience watching the market and a firm understanding of the appropriate pricing involved with this commodity.
Livestock Trading
Last, we look at livestock trading, which is generally conducted using contracts equal to 40,000 pounds. Most futures contracts in this space are drafted in February, April, June, August, and December. Tick values in these contracts are equal to 0.25 cents per pound, and the majority of the cattle traded in these markets is produced in the United States. When dealing with cattle, there are two specific types to watch: live cattle and feeder cattle. Live cattle is the more commonly watched cattle — and these animals will generally grow to a slaughter weight of around 700 pounds, on average.
Trading in livestock is more complicated than trading in grains, and is less commonly recommended for new investors. This is because the cattle will consume other commodities in order to survive and grow to the full slaughter weight. In this way, the price of corn, wheat, and soybeans can have a direct influence on the sale prices livestock markets. This is an influence that is not present within the grain markets themselves.
Crop shortages, droughts, and changes in weather can also have an impact on the available supply of livestock. Other factors can be found in the potential for disease (ie. Mad Cow disease), and anything that limits the available supply of usable cattle will generally put upward pressure on prices. Those looking to trade in livestock should be mindful of the Cattle on Feed report, which can be very useful in determining the level of cattle supply available in the market and the likely direction of market trends in the coming months.
Industrial Metals Trading
If we look only at the financial news media, it might be easy to think that gold silver and platinum are the only metals used in commodities investing. But there is more to these markets than the precious metals — and those looking to build a diversified commodities portfolio will need to possess some understanding of the industrials metals space, as well. Three of the most popular industrial metals choices for commodities investors include copper, aluminum and steel. Here, we will look at some of the factors involved for those looking to take an active market stance in the industrial metals space.
Steel Trading
Where precious metals are traded in troy ounces, the industrial metals space deals with much larger units of weight. So, when you see a quoted price for steel, it is referring to the price for each metric ton. In most cases, steel is refined from iron ore in its raw state and exists in bar form. There are six different exchanges where commodities traders can access steel markets: the London Metal Exchange, the CME Group, the Shanghai Futures Exchange, the Dubai Gold and Commodities Exchange, the Multi-Commodity Exchange of India, and the Indian National Commodity and Derivatives Exchange. The United States, China, and Japan are the world’s largest steel producers.
Most steel trading is conducted through futures contracts, and yearly volumes exceed one million metric tons. Steel trading can also be conducted using a commodities index fund. In terms of volatility, steel markets are vulnerable to significant price swings. This is mostly because steel trading in futures markets has not had a very long history. Since steel is mostly used in the construction of large buildings, commercial real estate markets represent key areas for research when trading steel. If construction activity in major cities starts to slow, demand for the metals drops and price declines are likely to be seen. Long-term, however, demand for steel is likely to remain supported given the fact that most of the world is still developing.
Aluminum Trading
Next we look at aluminum, which is a lightweight metal that can be found in nearly all aspects of our daily lives. Because it is so prevalent, some might assume that the available supplies must be diminishing quickly. But aluminum is actually the third most abundant element on earth, so supply numbers are still not much of an issue.
When trading aluminum as a commodity, most futures contracts come in amounts of 44,000 pounds. Each tick in these contracts is equal to 0.05 cents per pound and aluminum trades with a price limitation of $0.60 each trading day. This price limit helps to reduce market volatility and should be viewed as an attractive feature for commodities traders with a more conservative outlook. Most of the trading is conducted through the COMEX sub-section of the NYMEX, and futures contracts begin every month of each calendar year.
When we look at the factors that affect supply and demand for aluminum, it is important to consider items that require softer metals. This generally includes smaller consumer products like drink cans and food packaging, which make up the majority of industry usage. But there is also aluminum in larger products like airplanes, trains, and cars which require lightweight metals in order to keep fuel costs low. For these reasons, it is important to look at production numbers in these areas in order to get a sense of where aluminum prices are likely headed next.
Copper Trading
Last we look at copper, which is similar to aluminum in that its price is quoted in pounds. Most copper trading is conducted using futures contracts that flow the COMEX sub-section of the NYMEX. Futures contracts in copper are usually drafted in amounts equal to 25,000 pounds, with each tick being worth 0.5 cents per pound. Copper does not trade with a daily price limit (unlike aluminum), so this is a metal that has the potential for much larger price volatility in any given day. For this reason, copper is better-suited to commodities traders that have a more aggressive outlook and a bigger tolerance for risk.
When assessing the available supply of copper in the market, it is a good idea to look at its main producers. There are four companies that produce most of the world’s copper: Codelco, Freeport-McMoran Copper and Gold, Xstrata PLC, and BHP Billiton. Analysis of these companies will often given traders a very indication of the level of strength or weakness that is present in the copper markets.
On the demand side, copper is generally used for its conductivity properties. The end product for copper is often electrical wiring, so when we are seeing an increase in large infrastructure projects copper prices are likely to move higher. Bullish or bearish trends in copper are deeply connected to progress that is seen in emerging markets, as this is where infrastructure projects are likely to make progress over the next several decades. For these reasons, it is also a good idea for coppers traders to monitor GDP numbers in countries like India and China.
Oil Trading
When we think of the commodities markets, one of the first assets that comes to mind is oil. There is good reason for this. As the world’s main source of energy, trillions of Dollars flows through the oil markets each day. Since it is a finite resource that is decreasing in supply, general trends in oil are bullish. But this does not mean all “buy and hold” strategies are guaranteed to achieve profitability.
For these reasons, it is important for commodities traders to have a firm understanding of the factors that influence oil markets and change trends in valuation. Here, we will look at some of these factors, and discuss ways this information can be used in placing real money trades in the commodities market.
Economic Strength and Oil Demand
Oil is bought and sold by the barrell — and each barrel is composed of 42 gallons. When we see the quoted price of oil in the financial media, this is the amount of oil that is bought or sold for that quoted price. The Chicago Mercantile Exchange (CME) allows traders to trade oil in contract sizes equal to 500 barrels, but the traditional contract size associated with oil is 1,000 barrels. Traders that are looking to trade oil in smaller sizes can do so using commodities index funds.
Over the last several decades, increased demand in emerging markets (for example, China and India) has put upward pressure on the price of oil. Both of these countries are still in relatively early stages of development, so there is little indication that these trends will be changing any time soon. But there are fluctuations in demand that can be found in both emerging and developed economies. And commodities traders need to be aware of the economic strength or weakness in these areas in order to determine which future trends are likely to be found in the price of oil.
Strong economies tend to produce goods and services at a faster rate, and most of these activities are powered by oil. Economic data reports like GDP, manufacturing, and housing construction give traders critical information in determining whether oil demand will be rising or falling in a given location. Other indicators of a strong economy can be found in the stock markets found in each of these areas. A rising stock market suggests consumer optimism and strong corporate earnings. In these scenarios, oil prices tend to increase because there is greater demand for energy products. This means that stocks and oil share a strong positive correlation. So, when stock markets are falling, the reduced expectation for oil demand leads many commodities traders to start selling oil-related assets.
Consider the following chart in the S&P 500, which outlines the massive collapse that began in 2008:
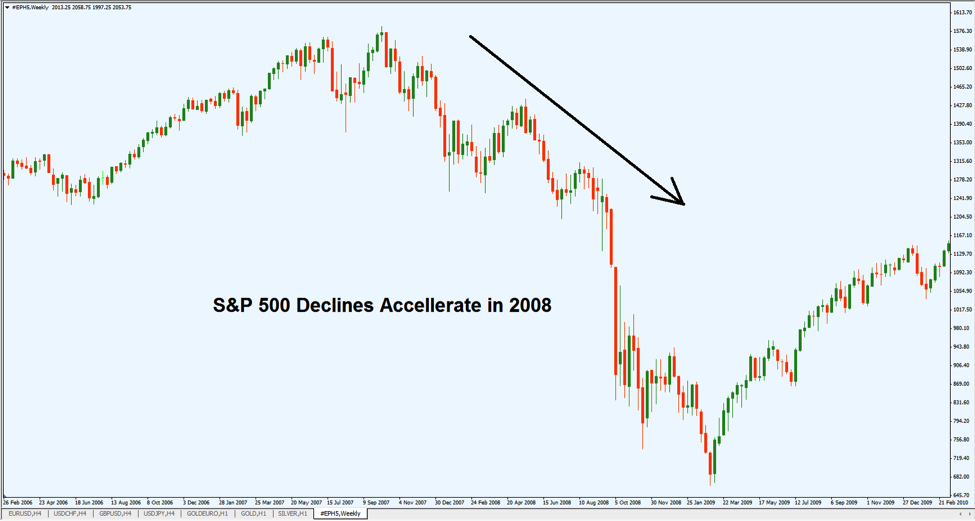
Chart Source: Metatrader
The S&P 500 is the most commonly traded stock benchmark in the world. So, when we start to see declines as large as what occurred in 2008, it is abundantly clear that there is turmoil in the global economy. When this is the case, markets will almost certainly experience slowdowns in manufacturing and consumption — and this puts added pressure on the outlook for oil.
Let’s look at the similarities seen in an oil chart from the same time period:
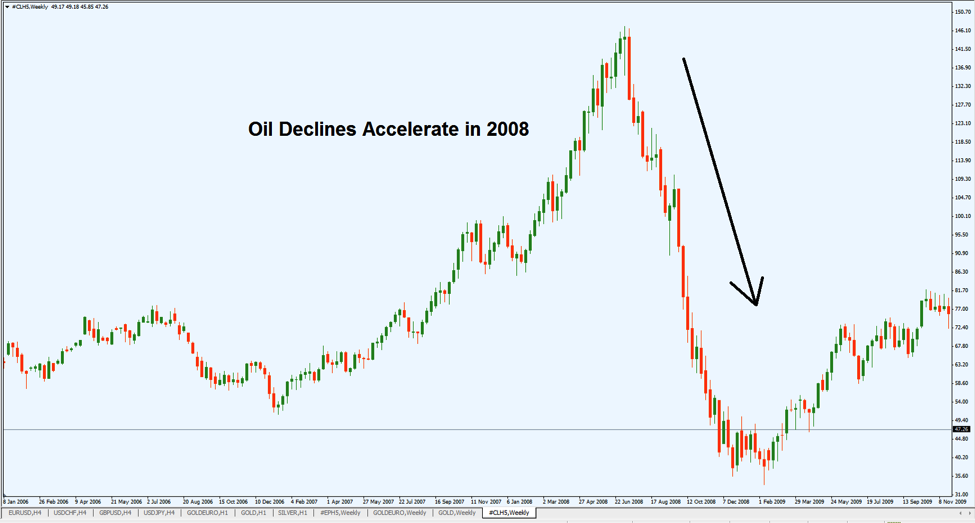
Chart Source: Metatrader
What does this chart tell us about the relationship between the stock market and oil prices? At this stage, it should be no surprise that stocks and oil are intimately connected — and directional pressures that influence one will likely influence the other.
When markets are healthy, demand for oil rises — and this pushes prices higher. This creates scenarios where long-term buy positions should be considered for oil-related assets. When markets are weak, demand for oil falls — and this pushes prices lower. This creates scenarios where short positions would make more sense. In these ways, commodities traders can use occurrences in the stock market as a means for determining whether to take a positive or negative stance in oil markets.
Geopolitical Uncertainty and Oil Supply
Broad trends in the global economy are useful in determining a long-term outlook for oil. But what factors should be considered by commodities traders operating under a shorter-term view? One area to watch is the level of geopolitical uncertainty in oil producing countries. Most of the world’s oil supply is located in the Middle East, but this also happens to be most of the most hostile regions in the world. If there are military conflicts that make it difficult to drill for oil and transport it to large markets, the price of oil could be impacted in potentially extreme ways.
But it should also be remembered that these conflicts tend to be short-term in nature. Oil companies have a lot of experience dealing with these locations and they are usually able to find ways of problematic scenarios. For these reasons, geopolitical conflicts should be used for short-term positioning in commodities markets. Generally speaking, military conflicts in the Middle East tend to be positive for oil prices. This might seem counterintuitive but the fact is that any transportation disruptions will limit the available supply of oil. Lower supply levels put upward pressure on oil prices. Once these conflicts resolve themselves, supply levels normalize, and oil prices fall back toward their averages.
Online Trading Platforms
Once you have a firm grasp on the basics of commodities trading, you are ready to choose a broker and start taking active positions. But in order to do this, you will need to assess the strengths and weaknesses of the brokerage sources that are currently available. There are many different types of trading platforms that are available online, so here we will look at some of the most important factors that must be considered before you select a broker. We will also include links to some of the most popular commodities trading brokerage sites.
Platforms for Beginners
For traders that are still new to the commodities market, it will be important to choose a broker that has live chat support for all trading hours. This is because when we are still in the early phases of trading it can be very easy to make mistakes that are costly and easily avoidable. For these reasons, it is always a good idea to select a broker that offers a free demo account that will allow you to trade under live market conditions using virtual currency. This will allow you to get a better feel for the mechanics of trading — and ensure that you know the size and type of position that is being opened in all cases. All of the brokerage platforms that are discussed here offer free demo account to their client traders.
One broker that is geared toward beginning traders is Interactive Brokers, which has customer service that is easy to access and a trading platform with a simple design. The trading software provides updated market quotes and free access to current analyst research. This type of offering can prove to be highly valuable for traders that are still learning to navigate the market. When you look at the website as a whole, it is clear that Interactive Brokers is focused on educating its users and providing easy to access live chat support so that all your trading questions can be answered. Interactive Brokers also offers both futures and options trading. Other brokers offering platforms that can be found in this category include TD Ameritrade’s ThinkorSwim, OptionsXpress, and TradeStation. Each of these trading platforms are designed with beginners in mind and are all relatively easy to master.
Platforms for Advanced Traders
For traders that have a significant amount of experience in the commodities market, it will be important to choose a broker that offers a broad list of tradable assets. It is also important to make sure that the platform enables you to trade both futures and options — as these are the two commonly used vehicles for placing trades in the commodities market. Other factors to consider deal with the charting software that is included. Traders with technical analysis strategies will require platforms that have customizable charting packages. TradeStation is one of the stand-outs for traders that are focused on technical analysis.
One choice that is designed to intermediate to advanced traders is Trader’s Platform, which offers a few different platform options for its clients. The software packages were designed by Optimus Trading Group, which is a well-established name in the business. Trader’s Platform syncs with outside platforms like the Chicago Mercantile Exchange (CME) and other pit-traded markets. Customer support is limited, as there is an assumption that Trader’s platform is used by more experienced traders. Another selection for intermediate to professional levels is ClearTrade, which has a software suite that is very well designed and includes newsletter research from several commodities trading think tanks. ClearTrade offers several pre-programmed software options which are designed to trade specific assets )for example, Gold, Euro, or Soybeans). For this reason, it is probably best for commodities traders that are focused on specific asset types.
Other notable mentions that fall into the advanced to professional category include Options House and Trade King. These brokers are known for offering regularly updated video sessions and trading signals that can be used for establishing active positions. It might not always be the best idea to take specific trades from another source, but there are resources that can be used for generating ideas in slow markets.
Conclusion
Commodities investors have many factors to consider when making the decision to settle on a broker platform. Factors like experience level, market strategy, and access to support are all factors that should be researched before placing any real money trades. At this stage, there are many different broker platform choices available so commodities traders should not feel handcuffed into selecting any one resource.
Platinum Trading
When we look at the financial media devoted to precious metals, most of the attention is centered on gold and silver. But the commodities market is a widely diverse space — and there are other assets that should be considered by those looking to establish a diversified investment portfolio. For traders with a “richer” sensibility, platinum offers some interesting advantages, as this is truly an asset that is “richer than gold.”
Historical Price Activity
Platinum is a very pure metal that is viewed as luxurious by the consumer market. This gives platinum an average price of roughly $1600 per troy ounce. Since it is such a rare metal, there are not many geographical locations where platinum can be mined — but South Africa is one of the world’s producers of the metal. This rarity also puts upward pressure on the price. But it should be remembered that since the consumer market is willing to pay exorbitant amounts of money for luxury items that include platinum (like watches and jewelry). So these are all factors that should be considered when commodities traders are looking to start investing in platinum.
Let’s take a look at how platinum prices have changed over the last 10 years:
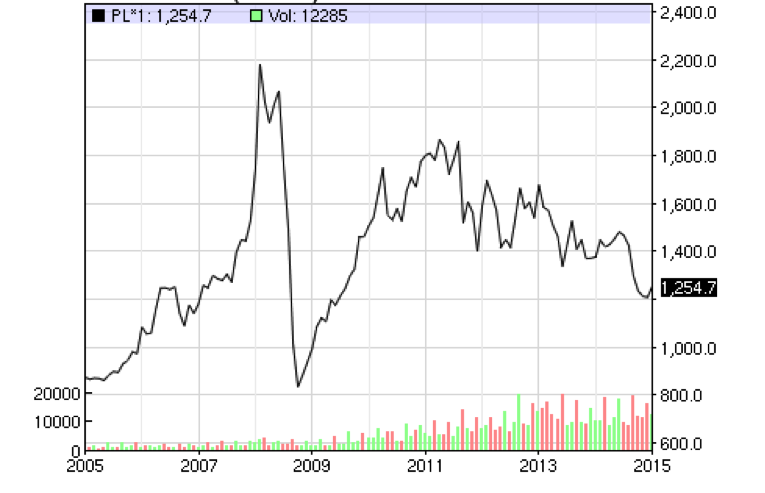
Chart Source: NASDAQ.com
In the chart above, we can see that platinum prices started 2005 just south of $900 per troy ounce. The economy steadily improved, and consumers were willing to pay more for luxury items that included platinum — and platinum prices rallied to nearly $2,200 per ounce at the beginning of 2008. It is no coincidence that stock markets were also rallying during this period, so the positive correlation between stocks and platinum is another factor to note.
Markets then began the massive decline that was seen toward the end of 2008, and platinum prices immediately followed suit. Consumers were buying fewer luxury items during this period and this reduction in demand brought market prices much lower. In fact, commodities traders short selling the metal quickly erased all of the gains that had been made since 2005, with platinum trading back below the $900 mark. This is a fairly significant price swing, so it should be remembered that platinum markets are capable of experiencing significant price volatility in a relatively short period of time.
Drivers of Supply and Demand
In order to protect yourself against the potential volatility in platinum markets, it is important to understand the drivers of supply and demand for the metal. When these factors are understood, it becomes much easier to decide on a directional bias and take an active stance in the market. In bullish scenarios, demand is rising and commodities traders will want to consider taking long positions to buy platinum. In bearish scenarios, supply is rising and commodities traders will want to consider taking short positions to sell platinum.
So for example, if we see strength in the underlying economy and rising consumer demand for luxury items, we should start to consider the bullish outlook. At the same time, declines in supply could have the same impact. If some of the large mines in South Africa slow production levels, there will be less supply available in the market. This is another factor that could drive prices higher. So commodities investors should be mindful of what is happening in the world’s largest supply locations.
Another factor to consider is the strength or weakness seen in the specific consumer sectors where platinum is used. For example, roughly 45% of the world’s platinum supply is used by the automotive industry. So, if we see a slowdown in automotive sales it would make sense for investors to start looking at platinum in a more bearish light. Auto sales are released every month in public reports, so this information is relatively easy to find. Other sectors using platinum can be found in jewelry (as mentioned above) and in the petroleum refining industry. These are all consumer areas that should be on the radar for anyone considering investments in platinum as a commodity.
Looking Ahead
Platinum shares similarities with gold as a precious metal — but there are some clear differences that are important to understand. Gold is a relatively soft metal that does not have many industrial uses. This is not the case for platinum and it seems as though businesses are finding new uses for platinum every day. Platinum is well-known for its excellent ability to transmit energy, so there is good reason to believe that we will continue to see new applications for platinum in the tech sector.
So if we do continue to see more uses for the metal, we can expect the value of platinum to be supported. In other words, more practical usage means more market demand. This supports the long-term outlook for platinum and helps make the case that some platinum exposure should be a part of any diversified commodities portfolio. For these reasons, platinum offers some key advantages for those looking to invest in the commodities space.
Silver Trading
When we think about precious metals, gold is usually the first asset that comes to mind. But when commodities traders limit themselves to a single market there are many investing opportunities that will be missed. For these reasons, it is a good idea to look at market sectors in their entirety. This way, you can scan through multiple assets and determine which trading opportunity is best.
In terms of precious metals, silver also comes in toward the top of the heap as far as media headlines and trading volume. In commodities trading, silver is similar to gold in that its valuations are given in troy ounces. At most trading exchanges, the standard contract size for silver is 5,000 ounces and is price much lower than gold. This makes it a much more accessible commodity for traders that are just starting out in these markets. Recent averages in silver show prices in the $17 range, and this is indicative of the larger bull run in commodities that has been seen over the last decade.
Historical Price Activity
Let’s take a look at a chart showing the market activity seen in spot silver markets over the last decade:
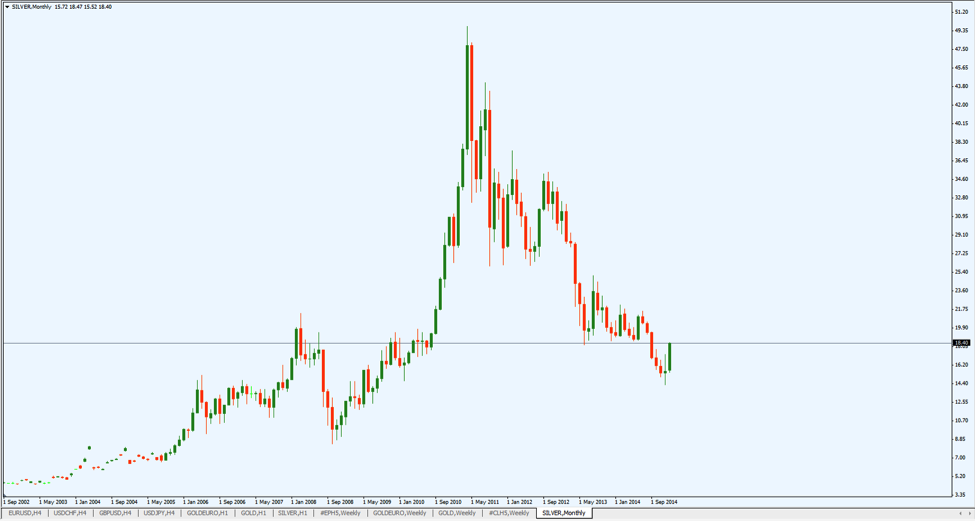
Chart Source: Metatrader
Here, we can see that silver markets started to experience enhanced volatility around 2005. For the most part, the resulting trend has been upward. But there have also been periods characterized by significant downside activity. This means that there have been opportunities for commodities traders to profit from moves in both directions. So while the general trajectory in silver have been positive (bullish), it does not mean commodities traders can simply buy the metal and expect prices to rise in the future.
Profiting from Silver Trades
Instead, successful trading in silver will depend on the specific price levels at which silver is bought and sold. If you buy silver at a low price and then sell it back to the market at a higher price, profits can be made. If you sell silver at a high price and then buy it back from the market at a lower price, profits can be made.
When trading silver, prices move in “ticks.” This is the minimum price movement seen for silver in commodities markets — and each tick is equal to $0.005 per troy ounce. So, when you are trying to understand how much a tick movement is going to affect the profits and losses in your trade, you will need to multiply this amount by the number of troy ounces associated with your contract. Completing these trades will require commodities traders to open an account using a broker regulated by the Commodity Futures Trading Commission. Trades can then be opened using online trading platforms that are able to access the commodities markets at acceptable price levels.
Leverage in Silver Trading
To make silver trades even more accessible, futures and options brokers will often allow traders to open with as little as 5% of the full contract size. This is a practice that is referred to as trading on leverage and this can make it easier for commodities traders with small account sizes to command larger positions. This enhances the potential for both gains and losses, and trades that are taken on leverage will capture all the profits that are tied to the total position size.
For example, a 5,000 ounce contract size trading at $17 an ounce should require a total investment of $85,000. But when commodities traders open position using leverage, this same position with could be established with only $4,250. This makes it much easier for new commodities traders to enter the global market using position sizes that are much more significant.
Market Conditions in Silver Trading
In general, silver assets tend to benefit from broad market uncertainty and building inflationary conditions that are present in the larger economy. This is another reason silver markets tend to trade in trends similar to what is seen in gold markets. If you are able to spot instances where inflationary pressures are building in the economic, it might be a good idea to start moving your cash into assets related to silver. Silver contracts are even cheaper than gold contracts, so newer traders will smaller account sizes would do well to establish long positions in silver if inflation is seen globally at the consumer level.
Another benefit to trading silver (relative to gold) is the fact that trading ranges tend to be smaller, given the lower valuations traditionally present in the market. For example, it would not be surprising to see a $100 per ounce price move in gold over a short period of time. At $15-17 per ounce, this is virtually impossible in silver markets, so this makes silver a better choice for commodities investors using a more conservative investment approach.
Silver has a long-established position in the financial markets — and this will not be changing any time soon. Silver traders are able to capitalize on market changes using leverage and benefit from conditions where global economic uncertainty or inflationary pressures start to grow. Silver is a less commonly traded commodity (when compared to gold). But there are some clear advantages for traders with small account sizes and watching silver markets will open up new opportunities for those looking at the precious metals space as a whole.
Trading the Commodities Index
When trading stocks, most investors are well-versed in the benchmark indices that are available. Examples here include the S&P 500, FTSE 100, and the Nikkei 225. But there are indices that are traded in the commodities markets, as well. There are many different choices available for investors that are looking to trade in specific asset classes. Generally speaking, these are divided by the type of commodity that is being traded. It would be impossible to cover all of the available commodities indices in a single article — but there are some broad characteristics that can be discussed and some popular choices that are regularly accessed by traders. Here, we will look at some examples of how commodities traders can get started investing in a commodities index.
Broad Funds
The first type of commodity index broadly tracks a wide variety of commodities. These funds invest in commodities derivatives or are based on the market’s expectations for whether commodities will rise or fall in value. These funds will select a basket of commodities and then have positive trends with the commodities gain in value or fall when those commodities fall in value. Commodities markets tend to move in the same general direction so it is relatively easy for commodities investors to figure out scenarios where these index funds are likely to rise or fall in the future. Here is a list of some of the most commonly traded funds that broadly track commodities:
● United States Commodity Index Fund (NYSEARCA: USCI)
● iShares GSCI Commodity-Indexed Trust Fund (NYSEARCA: GSG)
● E-TRACS DJ-UBS Commodity Index Total Return ETF (NYSEARCA: DJCI)
● PowerShares DB Commodity Index Tracking Fund (NYSEARCA: DBC)
● GreenHaven Continuous Commodity Index Fund (NYSEARCA: GCC)
Asset-Specific Funds
The next type of commodities index fund is the type that focuses on specific commodities, or specific commodities groups. There are some key advantages in these funds that should be noted by investors. For example, if you spend most of your time watching the precious metals markets, it makes sense to put most of your money to work in that area. It is true that commodities tend to move in the same general direction.
But in many cases, better gains can be made when you are able to identify opportunities in specific markets. A precious metals trader might not be aware of what is really going on in the grain or meat markets, so investing in an all-inclusive commodities fund might leave things vulnerable to unexpected price swings. Here, we will look at some of the different index funds, separated by asset class.
Commonly Traded Agricultural Funds:
● ELEMENTS MLCX Grains Index Total Return ETN (GRU)
● PowerShares Dynamic Food & Beverage ETF (PBJ)
● Teucrium Corn Fund (CORN)
● iPath Pure Beta Cotton ETN (CTNN)
● iPath Pure Beta Coffee ETN (CAFE)
● iPath Pure Beta Cocoa ETN (CHOC)
Commonly Traded Energy Funds:
● iShares MSCI ACWI ex US Energy Sector Index ETF (AXEN)
● Global X China Energy ETF (CHIE)
● PowerShares DB Energy ETF (DBE)
● Claymore/SWM Canadian Energy Income ETF (ENY)
● Direxion Daily Energy Bull 3X Shares ETF (ERX)
● Direxion Daily Energy Bear 3X Shares ETF (ERY)
Commonly Traded Metals Funds:
● SPDR Gold Trust ETF (GLD)
● iShares Silver Trust ETF (SLV)
● ETFS Physical Precious Metal Basket Shares (GLTR)
● iPath DJ-UBS Precious Metals Total Return Sub-Index ETN (JJP)
● iPath Pure Beta Precious Metals ETN (BLNG)
● PowerShares Global Gold & Precious Metals ETF (PSAU)
Using the Commodities Index in Trading
Commodities traders that are looking to trade the market as a whole or specific groups of assets should consider the commodities index fund as a tool for investment. There are many different ways of expressing a market stance, but when you are looking to take a more broad approach these funds offer some interesting advantages when compared to single assets traded in the futures or options markets.
In many cases, it is easier to take a broader view and assess the dominant trend in the market as a whole. So, for example, if you are spending more of your time analyzing energy markets, it might be less risky to take a position in an index fund rather than in an individual asset (such as crude oil). In these cases, you would only need to be correct for the directional trend in the asset class in order to capture profits. These are the factors that should be considered when looking at index fund investments. Broadly speaking, these funds can be a powerful tool to generate new trade ideas in the commodities space.