
Forex Advanced
Candlestick Reversal Patterns
Most forex traders that use technical analysis as the basis for their positions spend a lot of time watching candlestick charts. This chart type is useful on a number of different fronts, and one of the best examples of this can be found in the ways candlestick charts can make it easier to spot reversals.
When we talk about reversals, the main idea is that any prevailing trend has started to reach its exhaustion point and that prices are ready to start moving in the opposing direction. In the moment, it might seem very difficult to know that all of the previous directional momentum has actually run its course. But when we use candlestick formations as an identification tool, there are some specific signals that are sent on a regular basis. Here, we will look at various formations of the doji, as well as the bullish and bearish engulfing patterns.
Doji Pattern
The doji candlestick pattern is a strong reversal signal that shows market momentum is running out. Since the majority of the buying or selling activity has already taken place, any indication that the number of majority participants is dwindling can be used as an opportunity to start taking forex positions in the other direction. The doji pattern can be bullish or bearish in nature, all depending on the direction of the previous trend.
Let’s take a look at the structures of the doji pattern:
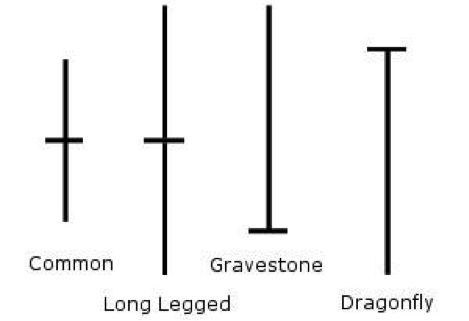
Chart Source: Forexmachines.com
The candlestick formations shown above might look different in form, but they all essentially tell the same story. The common doji pattern is composed of a very small candle body with an upper and lower wick. The long legged doji also has a very small candle body that is roughly in the center of the formation. In this case, however, the upper and lower wicks are longer which ultimately suggests that there was more volatility during that time interval.
The gravestone doji is one of the most bearish versions of the pattern. In this case, the pattern shows a very small candle body at the bottom, with a long wick to the topside. This pattern shows that markets rose quickly to levels that were unsustainable. Sellers then took over and the time interval ended. If this formation is followed by a full-bodied bearish candle, confirmation is in place and short positions can be taken.
The dragonfly doji is one of the most bullish versions of the pattern. In this case, the pattern shows a very small candle body at the top, with a long wick at the bottom. This pattern shows that markets fell to levels that were unsustainable. Buyers then took over and the time interval ended. If this formation is followed by a full-bodied bullish candle, confirmation is in place and long positions can be taken.
Let’s take a look at an example of a bearish doji pattern in a real-time AUD/USD chart:
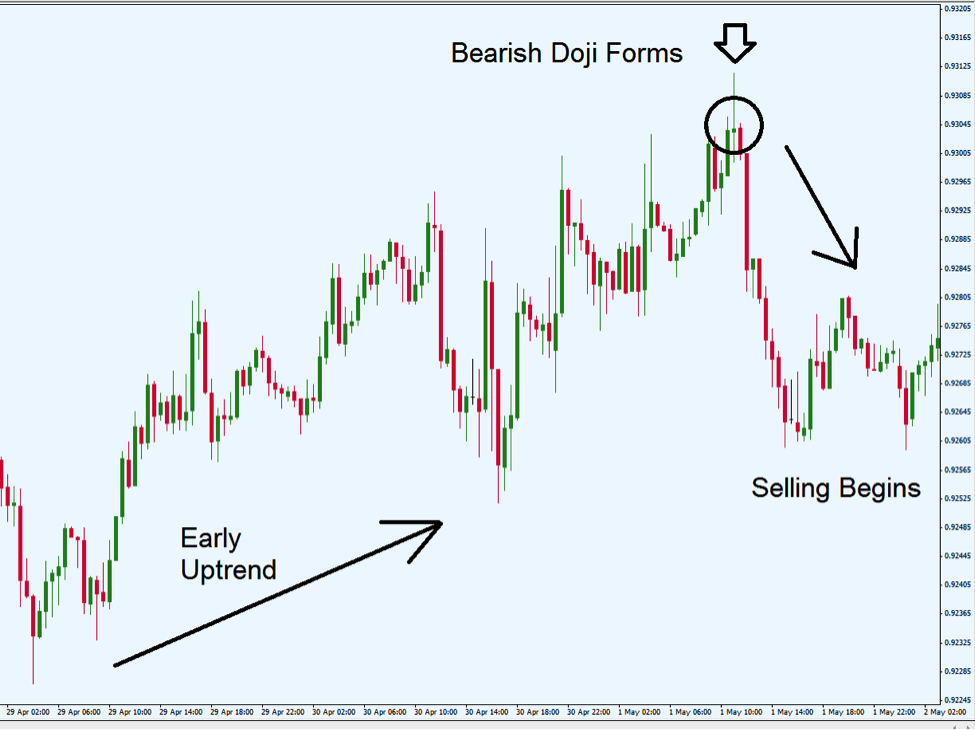
Chart Source: Metatrader
In the chart above, we can see that price activity was strongly bullish in the AUD/USD. But no trend can last forever, and market momentum starts to slow as process rise above the 0.9300 area. Here, a bearish doji pattern forms — suggesting that the previous bull trend is ready to reverse. After the doji is seen, a strong bearish candle forms, confirming the reversal pattern. Short positions could have been taken at this stage, and forex traders could have then capitalized on all of the downside movement that followed.
Bullish and Bearish Engulfing Patterns
In terms of candlestick formations, the doji pattern is relatively extreme and requires strict definitions for what can be seen in the body in order to be valid. But there is another pattern shape that is less rigid but just as powerful in the ways it can predict trend reversals. Next, we look at the bullish and bearish engulfing pattern, which is another candlestick indicator that can be used in establishing forex positions.
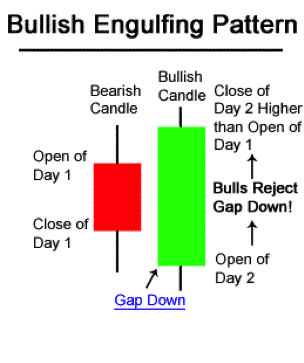
The following shows the structure of the bullish engulfing pattern:
Source: OnlineTradingConcepts.com
In the bullish engulfing pattern, a downtrend is seen coming to an end. Downtrends are dominated by bearish candles, and a small bearish candle is what is needed to start the bullish engulfing pattern. This small bearish candle is then followed by a larger bullish candle that overwhelms, or engulfs what was seen previously. In the graphic above, we can see that the first candle body is roughly half the size of the bullish candle body that follows. Markets initially push prices lower, and this downward gap creates a lower wick that extends below the initial bearish candle. Market momentum then reverses, extending to a new higher high and a strong positive close that is higher on Day 2.
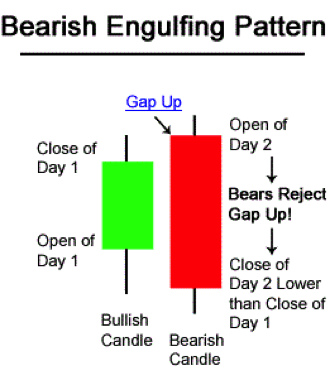
The following shows the structure of the bearish engulfing pattern:
Source: OnlineTradingConcepts.com
In the bearish engulfing pattern, an uptrend is seen coming to an end. Uptrends are dominated by bullish candles, and a small bullish candle is what is needed to start the bearish engulfing pattern. This small bullish candle is then followed by a larger bearish candle that overwhelms, or engulfs what was seen previously. In the graphic above, we can see that the first candle body is roughly half the size of the bearish candle body that follows. Markets initially push prices higher, and this upward gap creates a higher wick that extends below the initial bullish candle. Market momentum then reverses, extending to a new lower low and a strong negative close that is lower on Day 2.
With this in mind, consider the USD/JPY chart below:
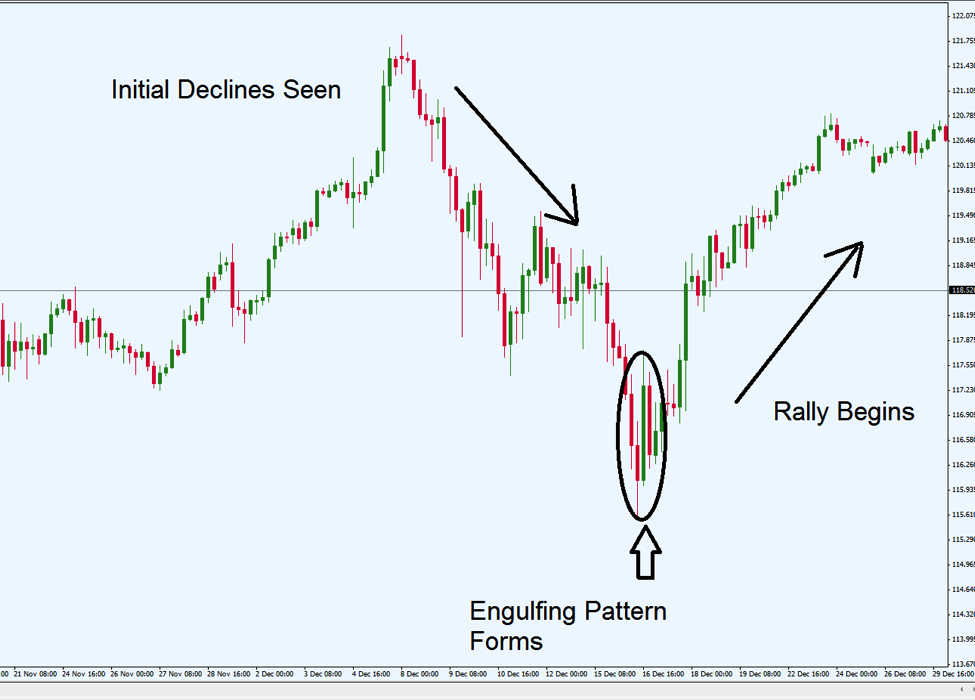
Chart Source: Metatrader
Which type of engulfing pattern is present here? Since the initial trend is downward and then we later see a bullish reversal, the type of structure here is the bullish engulfing pattern. Here, we can see that prices fall to roughly 115 — and the series of small red candles is ended by a strong green candle that suggests a reversal is imminent. Forex traders could have taken long positions here, and capitalized on the gains that followed.
Carry Trades
The forex market is associated some a few trading strategies that cannot be found in other asset classes. One example can be seen in the carry trade, which benefits from differences in interest rates that can be found when pairing currencies together. All forex positions involve the simultaneous buying and selling of two different currencies.
When traders buy a currency with a high interest rate in exchange for a currency with a lower interest rate, the interest rate differential accumulates on a daily basis. Over time, these positions can become quite profitable as the carry value of these trades is essentially guaranteed (as long as the interest rate differential remains intact). For these reasons, there are many traders that choose to focus exclusively on these types of strategies. Here, we will look at some examples of hypothetical carry trades in order to see how profits can be captured over time.
Currencies and Interest Rates
All currencies are associated with a specific interest rate. These rates are determined by the central bank in each nation. This is why monetary policy meetings at central banks are viewed with a high level of importance by forex traders. When you buy a currency, you gain the interest rate for as long as you hold the position.
For example, if the European Central Bank has set its benchmark interest rate at 2.5%, you will gain 2.5% on your position for each year you hold that currency. If you were to sell the currency (ie. in a short position in the EUR/USD), your forex account would be debited -2.5% for each year you hold the position. In all cases, these credits and debits will accumulate daily once the position is held through the rollover period at 5pm.
Trading Examples
Let’s consider a few hypothetical trading examples using the carry trade rationale. Historically, the Australian Dollar (AUD) has been associated with high interest rates while the Japanese Yen (JPY) has been associated with low interest rates. For this reason, the AUD/JPY is one of the most popular options for carry trades.
Hypothetically, let’s assume that the Bank of Australia has set its base interest rate at 5%. Let’s also assume that the Bank of Japan has set its base interest rate at 0.5%. The interest rate differential for these two currencies would then be 4.5%, so if you were to buy the AUD/JPY and hold the position for one year you would earn a guaranteed 4.5% on your position. This would be independent of any changes seen in the underlying exchange rate between these two currencies.
Negative Carry
As a point of illustration, it should also be understood that carry value can also work in the opposite direction. Let’s assume that the Federal Reserve has set the interest rate for the US Dollar at 3.5%. At the same time, the Bank of Canada has set the interest rate for the Canadian Dollar at 2%. What would occur if you chose to take a short position in the USD/CAD?
A short position in the USD/CAD would mean that you are selling the USD and buying the CAD. Since you would be buying the currency with the lower interest rate, your position would be exposed to negative carry — which in this case means that your trading account would be debited a value equal to -1.5% of your position for each year the position is held. This is because the interest rate differential between the USD and CAD is 1.5% (3.5% and 2%). Because of this, long-term positions that are associated with negative carry are exposed to greater risk because the losses are guaranteed. Any profits that might be generated by potential changes in the underlying exchange rate would still need to account for the carry costs incurred during the life of the position.
Long-term Positioning
Forex traders that employ carry trade strategies tend to be traders that possess a long-term outlook. This is because it usually takes a great deal of time in order to generate sufficient profits to justify the position. The interest rate values that are quoted by your forex broker are given on a yearly basis. This does not mean that you will be required to hold your positions for a full year in order to capture the benefits of the carry trade. All positions are pro-rated, and your final profits and losses will be determined by the exact length of time you held each position.
Most forex traders in the advanced stages of their career tend to place the majority of their focus on the currency market. There is good reason for this, as it allows for greater familiarity within a specific asset class. But one problem with this approach is the fact that it becomes very easy to forget that all markets are interconnected and greatly influence one another.
Forex is certainly no different, and so it makes sense to have an understanding of the ways areas like stocks and commodities work with (and against) currency markets. Here, we will look at some of the factors that drive correlations between forex and the other major asset classes.
Stock Benchmarks
Individual stocks have little to no influence on the forex markets, but this is not the case when we look at the benchmark indices as a whole. Closely watched instruments like the S&P 500 or the FTSE 100 can have a significant influence on currencies — especially the currencies that are most closely associated with those geographical regions.
Strongly bullish days in the German DAX and French CAC 40 tend to support forex pairs like the EUR/USD and EUR/JPY. Positive activity in the Nikkei 225 tend to create selling pressure in the forex pairs denominated in the Japanese Yen (as the JPY is the counter currency in these pairs). Prices changes in the GBP/USD will often be influenced by the FTSE 100, and many forex traders will wait to see the prevailing trends in each of these benchmarks before establishing short-term positions.
In the case of the US Dollar, things tend to work in reverse. Since the USD is generally considered to be a safe haven asset, it will often trade in the opposite direction relatively to the central benchmarks in the US — the S&P 500 and the Dow Jones Industrials. This means that on negative stock days, traders tend to take their money out of stocks and store it in cash. This benefits the USD and shows that there is a negative correlation relationship between the currency and its most closely associated stock benchmarks. So days that are strongly bullish for the S&P 500 and the Dow Jones will generally create a more negative outlook for the USD.
Commodities
Commodities markets will impact forex prices in different ways. Countries that are known for metals production tend to benefit when the price for those assets is increasing. For example, there is a large amount of copper production in Australia. On days where copper prices are rising, currency pairs like the AUD/USD tend to benefit. In the same way, high levels of gold production in Canada create a positive correlation between the price of gold and the CAD. On days where gold prices are rising, currency pairs like the CAD/JPY tend to rise (and vice versa).
At the same time, the USD tends to work in the opposite direction. This is because commodities are priced in US Dollars, so traders will generally need to sell Dollars in order to buy gold or oil. If you see a trading day where oil is rallying, there is going to be at least some downside pressure placed on the USD as the broader order flow that is seen in the market will require extra sales of the Dollar.
Conclusion: Remain Cognizant of Trends in Alternative Markets
For all of these reasons, it makes sense to remain cognizant of trends in other asset classes — even if it seems like there is no direct connection between your forex trade and the latest price moves in stocks or commodities. For the most part, what you should be looking for are negative and positive correlations, and then watch what is happening in alternative markets before you place any new forex positions.
These correlations alone might not be enough to use as a sole basis for new positions. But these are factors that should be considered, as there are clear influences that can be measured. Having a firm understanding of the broader interconnection between these markets can help you turn your probabilities for success back into your favor over the long run.
Diversifying A Forex Portfolio
Most with experience trading in the financial markets understand that diversifications is generally a good thing. When we think of diversification, it is usually associated with stock investments that are spread over a number of different industry sectors. But it is possible to diversity your forex portfolio, as well. This can be done by separating currencies into different categories and making sure that you are not “doubled-up” on any one asset. Here, we will look at some of the factors that go into diversifying a forex portfolio.
Avoid Doubling-up
First, it must be understood that having multiple positions in a single currency can be especially problematic. For example, let’s assume a forex trader buys one lot in the EUR/USD and one lot in the EUR/GBP. It might seem as though the trader is taking two entirely different positions, but nothing could be further from the truth. In a scenario like this, the forex trader would essentially be taking a double position in the EUR — even though it is being done against two different currencies. Here, the trader would essentially be “placing all the eggs in one basket” and would be especially vulnerable if any weakness is seen in the Euro.
In a case like this, it would be much wiser for a trader to take a half-position in both of these currency pairs, as this would limit the excessive exposure in the Euro currency. Taking on excessive exposure in any single currency can be very dangerous, and break many of the basic forex rules that require proper trade management. There is nothing wrong with separating your stance across more than one currency pair. But proper trade management rules dictate that no forex position should expose your account balance to losses of more than 2-3%. So if you are looking to express your market views using more than one currency pair, it is important to avoid taking full-sized positions that buy or sell a single currency. This is not much different than taking two positions in one pair, as any downside activity in the currency you are buying will effectively generate twice the losses.
Watch Currency Correlations
Another factor to consider is the currency correlation. Many currencies tend to fall into the same category, and if you are looking to achieve diversification in your forex portfolio, you will need to create exposure to more than one asset type. For example, the US Dollar (USD) and Swiss Franc (CHF) both fall into the safe haven category that benefits from economic uncertainty and declining stock markets. The Japanese Yen (JPY) is another currency that benefits from these types of scenarios as forex traders will often look to close out carry trade positions.
Other examples include traditionally high-yielding currencies like the Australian Dollar (AUD) and New Zealand Dollar (NZD). At the same time, the Euro and British Pound (GBP) tend to move in similar directions, given the interconnected nature of both economies.
Achieving Diversification
With all this in mind, forex investors with a long-term outlook should look to spread their portfolio across more than one currency type while avoiding doubling-up on any one position. For example, forex investors might look to create some exposure to high yielding currencies while still maintaining long positions in a safe haven currency in order to protect against unexpected shocks in the market. In this way, modern portfolio theory can be applied to markets other than stocks and it can be used to smooth volatility in your collective positions.
Forex traders should be looking at their portfolios as a collection of positions, rather than a vehicle for buying a single currency in multiple pairs. When you play to the strengths of multiple forex types, it becomes much easier to harness the positives that are seen each currency class. At the very least, it must be remembered that true diversification cannot be achieved using more than one full position in a single currency. It is possible, however, to take a majority position in one currency while using reduced position sizes. In the initial example presented here, a trader would be much more secure and protected from risk if the EUR positions were reduced. This could mean reduced positions across pairs like EUR/USD, EUR/GBP, and EUR/AUD.
Forex Algorithmic and Quantitative Trading
We have seen many new trends in financial trading over the last decade. One of those is the fact that Forex trading became popular as the internet became more widespread. But along with this has been an increased trend in computer-based trading that allows for the implementation of automated strategies. For the most part, these trades are based on predetermined technical analysis strategies that have been back-tested and proven successful over time.
That said, automated trading does involve some level of risk and there are many black box packages that promise significant returns over a short period of time. Any extreme promises like this should be met with at least some level of skepticism. But the fact remains that algorithmic and quantitative trading is a valid part of the forex market — and this will not be changing any time soon. Here, we look at some of the factors that should be considered before placing algorithmic trades that are based on quant strategies.
Algorithmic / Quantitative Strategies Defined
First, traders must understand what is meant by algorithmic and quantitative trading. Specifically, these terms refer to instances where forex traders initiate positions that are defined by predetermined mathematical formulas. For example, trades might be triggered when prices rise above or below a certain moving average. Factors like price momentum, standard deviation, historical averages and trend strength tend to be used as a basis for most of these strategies. Once a specific set of criteria are met, trades are placed — and this can even include added elements like the placement of stop loss orders and profit losses.
Expert Advisors
To trigger these trades automatically, forex traders will generally use an Expert Advisor, or EA. This can be done using a forex trading platform that allows for automated trading. Some of the most common choices here include TradeStation and Metatrader, which are both highly customizable platform that allow for algorithmic and quantitative trading. So if you are interested in actually using this type of strategy, you will want to make sure that you use a forex broker that offers platforms like these or something similar.
When looking for the EAs themselves, the options are much broader. To get some perspective, your forex trading platform can be thought of as your computing device and the EAs that you use can be thought of as an app. These apps will trigger trades automatically — as long as your predetermined market criteria are met and your trading station is open and working. EAs can be found through a simple web search, but some sources for these are certainly more reputable than others. It is often better to use EAs that can be found through forex trading communities, as these can be objectively tested and reviewed. Without this added security, it is sometimes difficult to know whether or not the EA has been accurately back tested and is truly capable of producing its claimed results. Two popular sources for EAs can be found at Forex Peace Army and Forex Factory. Many of the EAs listed on these sites are free of charge.
Pros And Cons
As we said before, automated forex trading is associated with its own set of benefits and drawbacks. On the positive side, algorithmic and quantitative strategies allow forex traders effectively monitor all aspects of the forex market — even when they are not actively monitoring their trading station. Think of it this way, you might have a highly successful strategy but it would be impossible to watch every forex pair for instances where your predetermined criteria are met. Computer-based strategies have that capability and this can allow you to capitalize on forex trades that you might have missed otherwise.
On the negative side, you will almost certainly see instances where your EA has opened a trade that you might have avoided yourself. Unfortunately, computer algorithms are digital models that are meant to understand an analogue world — and there will be instances where your EA model will open positions more aggressively than you might have on your own. For these reasons, it is generally a good idea to keep your forex position sizes smaller than you might when you are trading manually.
On the whole, it is best to look at your success rates over time and then stay with a given EA if it produces positive results that are consistent. Algorithmic and quantitative trading is not something that should be undertaken in a haphazard way, as it could open up your trading account to potential losses. But if these strategies are properly researched (and accurately back tested), automated strategies can be a powerful tool to add to your forex trading arsenal.
Forex Momentum Oscillators
In order to make money in the forex market, you will need to have some way of forecasting where prices are likely to head in the future. One of the best ways of doing this is to make an assessment of where the majority is the market’s momentum is placed. There are many ways of doing this but technical analysts tend to have an edge in these areas with the help of some proven charting tools. Two of the most popular choices can be found in the Momentum Oscillator and the Relative Strength Index (also known as the RSI). Here, we will look at some of the ways forex traders use these tools and then provide some visual examples in active currency charts.
The Momentum Oscillator
When looking to assess the dominant momentum seen in the forex market, a good place to look is the Momentum Oscillator. This charting tool enables forex traders to measure the rate of change that is seen in the closing prices of each time interval. Slowing momentum can be an excellent indication that a market trend is ready to reverse. When reversal points are accurately pinpointed, forex traders are able to “buy low and sell high” before the rest of the market has made the transition.
In short, traders should side with the dominant trend when the Momentum Oscillator indicates strengthen. Traders should bet against the trend when the Momentum Oscillator slows and suggests that the market is reaching a point of exhaustion. Let’s take a look at a real-time chart example using the GBP/JPY:
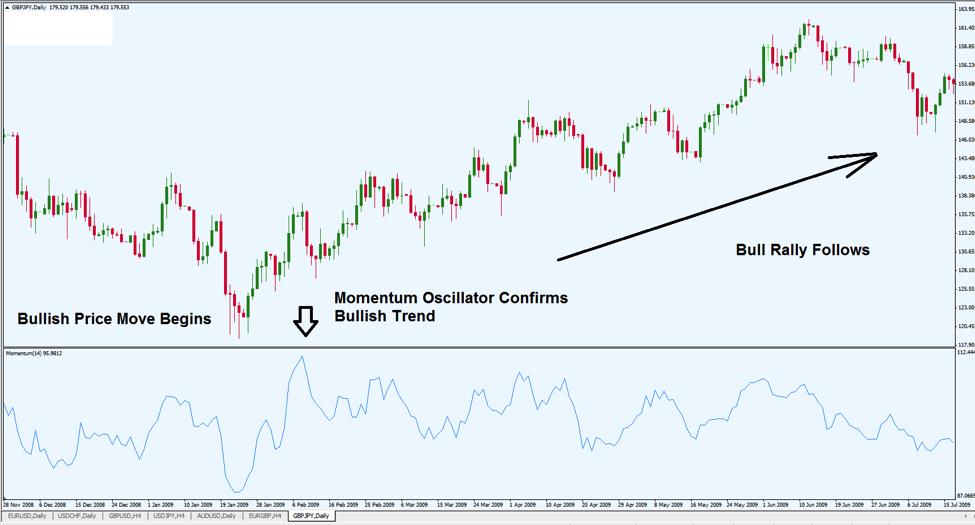
Chart Source: Metatrader
Here, the Momentum Oscillator is plotted below the price activity and shown in blue. A rising line suggests that market momentum is building. When the momentum line falls to the bottom of the measurement, momentum is leaving the market.
In this example, we can see that prices fall to their lows near 119.20. Prices then begin to rise and this is accompanied by a strong trend signal sent by the Momentum Oscillator (shown at the first arrow). This would be in indication for forex trader to side with the direction of the latest price move — which, in this case, is bullish. The GBP/JPY then experiences a massive rally above the 160 mark. In this case, a forex trader could have seen the early signals sent by the Momentum Oscillator and initiated a long position in the GBP/JPY. If this was done, significant profits could have been realized with little to no drawdown.
The Relative Strength Index (RSI)
Another option for measuring momentum in the forex markets is to use the Relative Strength Index, or RSI. This chart tool compares recent gains and losses to determine whether bulls or bears are truly in control of the market. Next, we will look at a charted RSI example using the USD/JPY:
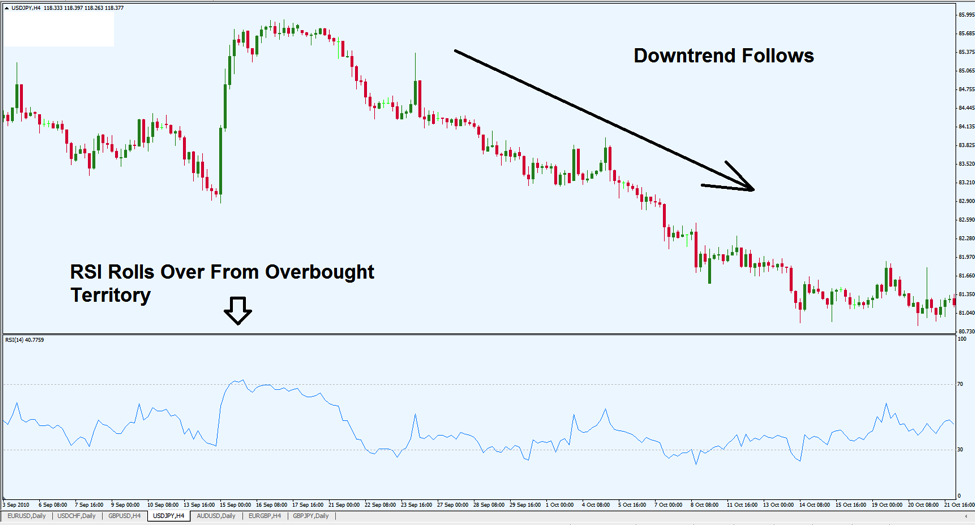
Chart Source: Metatrader
The RSI ranges from 0 to 100. Indicator readings above the 70 mark are considered to be overbought, while readings below the 30 mark are considered to be oversold. Buy signals are generated when the indicator falls below the 30 mark and then move back above that threshold. Sell signals are generated when the indicator rises above the 70 mark and then move back below that threshold.
In the USD/JPY example above, we can see that the requirements for the bearish stance are met as the indicator hits overbought territory before the RSI reading starts to turn lower. As this occurs, the USD/JPY is trading at 85.80. Ultimately, the pair falls to 80.90 before turning back upward, which means that any trader acting on the momentum signal generated by the RSI sell signal could have captured nearly 500 pips in profit with very little drawdown. In this way, the RSI can be a highly effective tool is assessing whether market momentum is likely to be bullish or bearish in the hours, days, and weeks ahead.
Forex traders looking to establish positions based on the underlying momentum present in the market can benefit greatly after consulting the RSI, as it is a quick and easy way of assessing whether or not market prices have become overbought or oversold.
Forex News Trading
Forex traders that are looking to base their positions from the perspective of fundamental analysis will almost always use new releases in forming a market stance. These news releases can take a variety of different forms, but the most common (and relevant) for forex traders is the economic news release. These reports are scheduled well in advance and are generally associated with market expectations that are derived from analyst surveys. Economic data calendars can be found easily in a web search, one good example can be found here.
In some cases, these expectations are accurate. In other cases, they are not. So it is important for forex traders to monitor developments in these areas, as there are many trading opportunities that can be found once important news releases are made public. One of the best ways to approach this strategy is to look for significant differences between the initial expectations and the final results. When the market is reacting to the new information, volatility spikes are seen and the large changes in prices can be quite profitable if caught in the early stages.
Assessing Data Importance
Of course, not all economic releases are associated with the same level of importance. Reports like quarterly GDP, inflation, unemployment, and manufacturing tend to come up toward the top of the list. But there will be cases where other, more minor economic reports are more relevant for a specific scenario. For this reason, it is important to avoid falling into a rigid routine when assessing which data reports are likely to be important and which are not.
One of the best ways to assess whether or not a given report will significant move the market is to simply watch which upcoming reports are getting the most attention in the financial media. These reports tend to generate headlines once the results are finally made public, and financial news headlines will often dictate which trend is dominant on any trading day.
Real-time Chart Example
Let’s take a look at a real-time chart example in the USD/JPY. In this case, markets were eagerly awaiting quarterly GDP figures out of the United States. Forex analysts were expecting a decline of -0.5% for the period, and this negative expectation sent the USD lower across the board. These trends forced the USD/JPY to lows near 92.70 just prior to the data release.
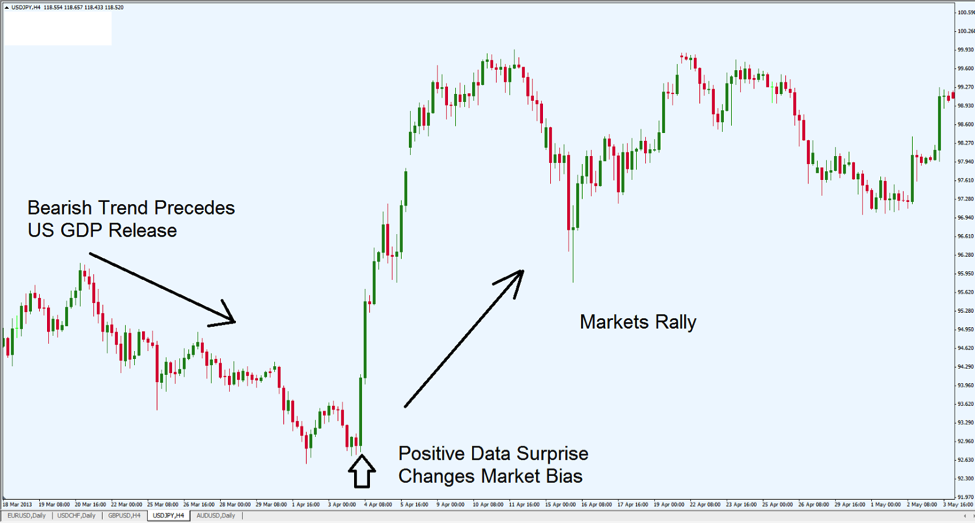
Chart Source: Metatrader
But onces the report was actually made public, it quickly became clear that the consensus estimate was incorrect — and US quarterly GDP rose at a rate of 1%. In the chart above, we can see that the market reaction was quite pronounced and overtly bullish for the USD. Prices eventually rallied above the 99.50, driven largely by the changing market expectations for the overall outlook in the USD. Any trader that was actively watching the newswires during this release could have jumped in on this rally in the early stages and captured massive profits with little to no drawdown.
Scenarios like this happen all the time. The reality is that it is quite difficult for forex analysts to accurately predict the results of economy data in all cases. Macroeconomic data is influenced by a countless number of factors (both national and global in nature), so it is essentially impossible for forecasters to build mathematical models that can make accurate forecasts every time. But it is important to remember that these differences between expectation and reality are the instances that create the greatest opportunity in forex markets. In essence, large surprises create large price moves. And these price moves can be translated to large profits if caught in the early stages.
Minimizing Risk
A final point to note is that news driven market events tend to create extreme volatility in forex prices. This increase potential reward also carries with it the increased potential for risk, so it is absolutely essential for forex traders to make sure that any established position is placed using a protective stop loss. In most cases, news data tends to force prices on one direction with very little to be seen in corrective retracements.
But this will only work for positions that are taken in the direction of the data (ie. bullish positions for positive data, bearish positions for negative data). It can be difficult to place news positions quickly in some cases, so all orders must be placed to a good deal of care and attention. News trading can be quite profitable when done correctly — but a certain level of caution is warranted, as well.
Forex Technical Indicators
Technical analysis is a popular method used in the forex markets, as it allows traders to view price activity in objective ways. This is helpful because it allows traders to spot not positioning opportunities before big price moves start to take shape. It can be argued that technical analysis is even more popular in forex than it is in areas like stocks or commodities. So, for those looking to tackle the currency markets and achieve long-term profitability, it makes sense to have a solid understanding of the terms and strategies that are commonly used.
Since chart analysis has such an important impact on forex trading, it is not surprising that we see some technical indicators used that are less commonly known in other markets. Indicators like the Relative Strength Index (RSI) and the Moving Average Convergence Divergence (MACD) have their place in forex trading just as they do in stocks, commodities, and futures. But alternative indicators like Stochastics and Bollinger Bands are two examples of charting tools that might be less commonly known in the other financial markets. Here, we will look at ways trades can be placed when using these technical indicators.
Bollinger Bands
Bollinger Bands were developed by a famous chart technician named John Bollinger. They are designed to literally envelope price action and give traders an idea of how far valuations might move if market volatility starts to increase. Let’s take a look at a real-time example using the AUD/USD:
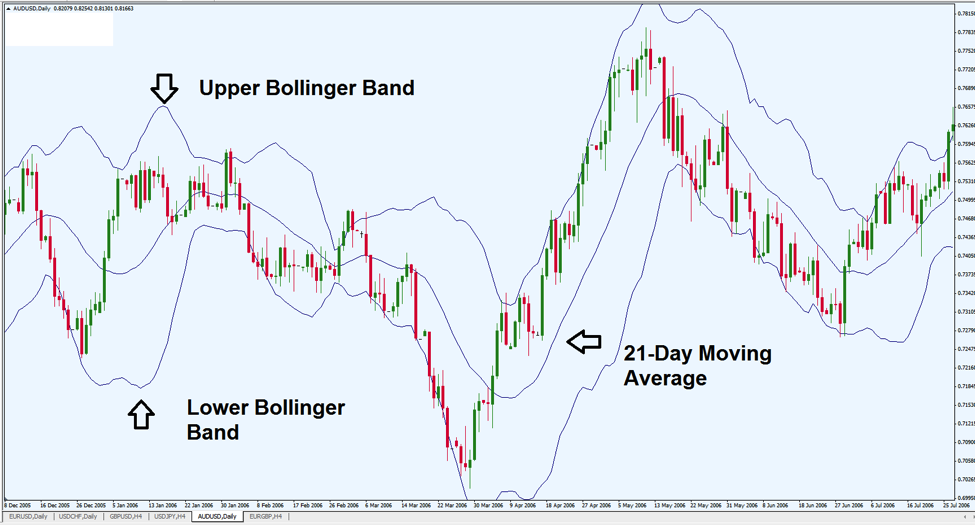
Chart Source: Metatrader
In the example above, we can see that Bollinger Bands are composed of three different lines that move in tandem with price activity. The upper band can be thought of as a resistance line, the lower band can be thought of as a support line. These two lines are then plotted along with a 21-period moving average, which is generally near the middle of the underlying price action. The upper and lower bands are placed two standard deviations away from price activity. These bands will tighten as market volatility declines, and then widen as market volatility increases.
In terms of buying and selling signals, there are a few different points to note. First is that Bollinger Bands can be great in predicting future volatility. Again, we look at price activity in the AUD/USD:
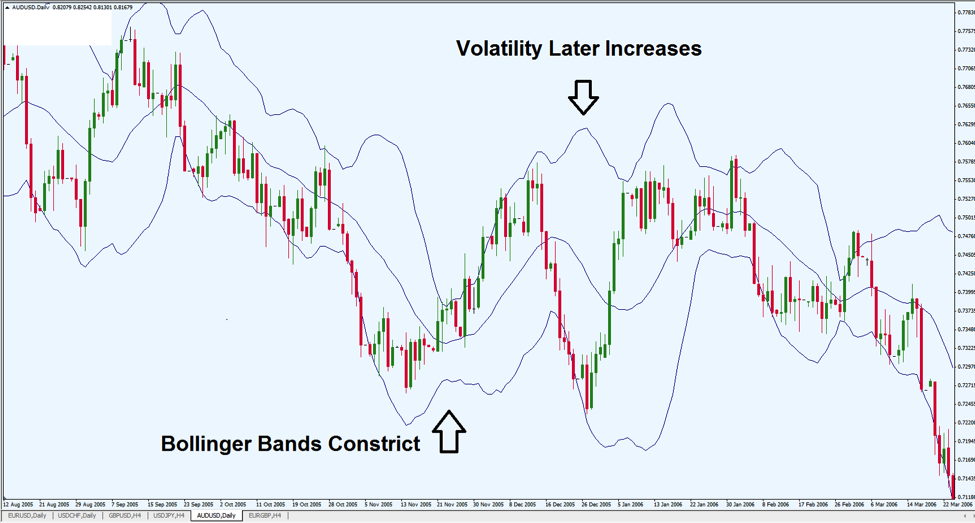
Chart Source: Metatrader
In the chart above we can see that the Bollinger Bands constrict. This indicates a period of indecision in the market as fewer traders are activity buying and selling. But conditions like this can only last for so long. It might be that the majority of the market is waiting for an important economic release, and once that data is made public volatility should start to increase in a relatively predictable direction. Essentially, tight Bollinger Band readings suggest that the market is getting ready to make a big move (although the direction of that move is not yet apparent). Wide Bollinger Bands suggest the reverse, as excessive volatility will probably start to settle.
Next, we look at ways the Bollinger Band indicator sends buy and sell signals to the market. Again, we look at the AUD/USD:
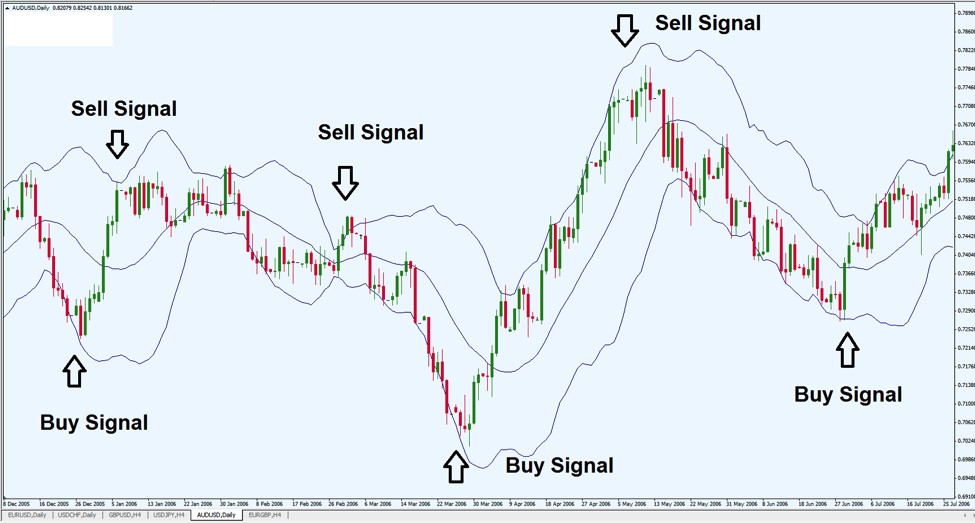
Chart Source: Metatrader
In this chart example, we can see the various says that Bollinger Bands send buy and sell signals to the market. Since the upper and lower bands should be thought of as dynamic support and resistance levels, the currency should be bought when prices fall to the lower band and sold when prices rise to the upper band.
This is true because any time prices have reached the outer band, it shows that prices have now moved two standard deviations away from their historical average. Prices can only exist in these areas 5% of the time, so when prices are seen in these areas a reversal should be expected. For this reason, the currency pair should be sold when it rises to the upper band, and bought when it falls to the lower band.
Stochastics
Another technical indicator that is largely unique to common use in the forex market is the Stochastics indicator. This technical tool is useful in determining when prices have become cheap relative to the historical averages (oversold) or too expensive relative to the historical averages (oversold). Where Bollinger BAnds are plotted with price activity, the Stochastics indicator is plotted separate from the price action (below).
Let’s take a look at a chart example using the GBP/USD:
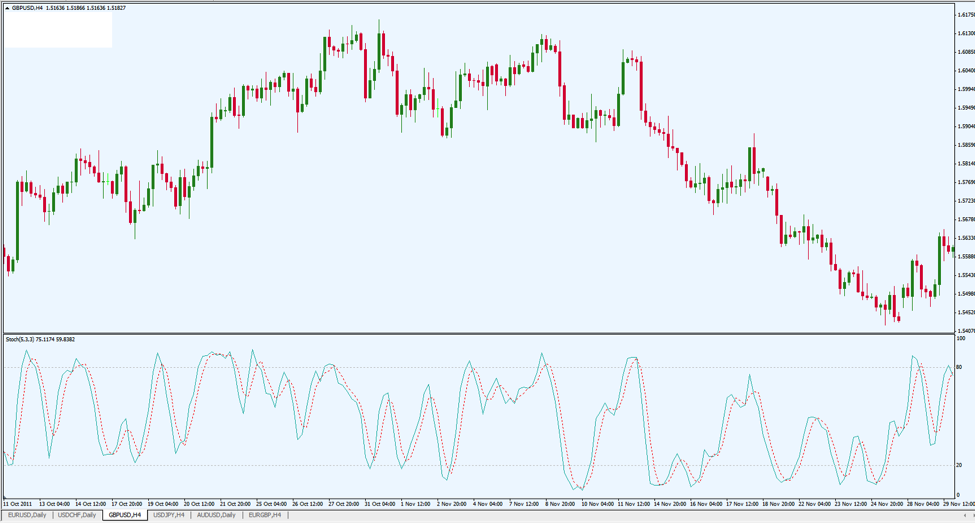
Chart Source: Metatrader
As you can see, the Stochastics indicator is plotted on a graph from 0 to 100. Readings above the 80 mark qualify as overbought, while readings below the 20 mark suggest the currency pair is oversold. Overbought readings suggest that traders should consider selling the currency pair, oversold readings indicate traders should consider buying the currency pair.
Next, let’s look at some sell signals that were sent in this chart:
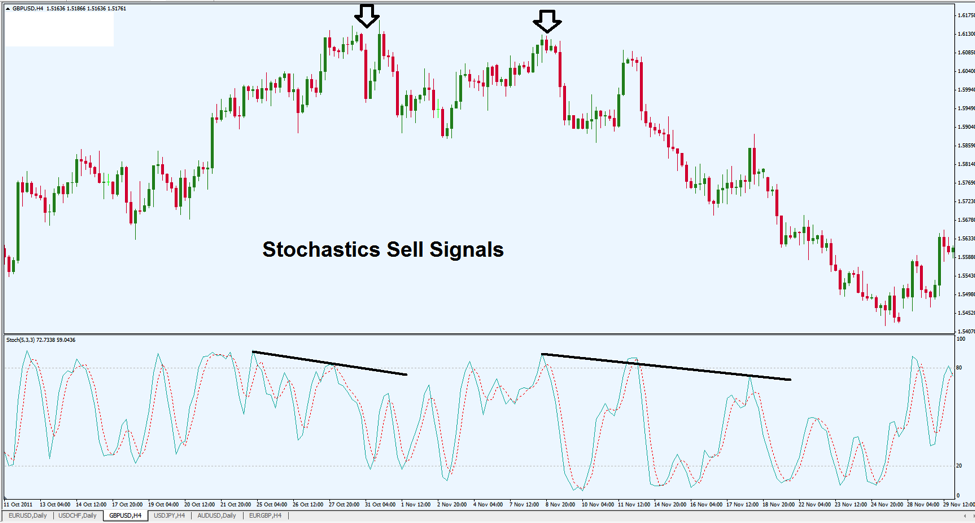
Chart Source: Metatrader
In this chart, we can see a clear downtrend. But if we look at the activity in the Stochastics readings, sell signals were sent early on. When we look at the oversold readings that start near the halfway point, we can see slowing momentum in the levels that were hit by the indicator. This weakening momentum (ie. the indicator is no longer able to reach the same highs) should have signals that forex traders could start to sell the currency pair, prior to the massive downtrend that followed.
Trade Management and Trailing Stop Losses
One of the biggest mistakes made by new traders comes from the belief that once you initiate a trade, the process and your work as a trader is over. Unfortunately, nothing could be further from the truth. And if you fail to actively manage your trades once they are placed, you will almost certainly encounter unnecessary losses. The forex market is always moving and evolving, and in many cases the environment can change significantly after your trade is placed. For these reasons, there will be instances where traders will need to adjust their stop loss levels and profit targets. Here, we look at some methods to manage your trades from a protective standpoint in adjusting your stop losses after the initial trade is executed.
Active Stop Management
On the positive side, if you are ready to adjust your stop loss it probably means that your position is gaining (in the money). If the market was moving against you, your stop loss likely would have been hit on its own. Many traders will look at trade management from a pip standpoint.
For example, a trader might start to adjust the stop once the trade is positive by 50 pips. One strategy in a situation like this is to take profits on half the position, and then moving the stop loss to the break even point (the price level at which the trade was opened). This method effectively allows traders to capture some profits while removing any potential for further risk. If the stop loss is hit later, no losses will be seen.
There are other methods that follow the same general logic but do not rely on pip values. For example, a trader might instead look at percentages as a way of determining when a stop loss should be moved. If the trade has made gains of 1-2% it would generally be a good idea to start taking risk off of the table and moving your stop losses to the break even point. In any case, there is nothing wrong with taking profits on at least some portion of your trade. As the old forex markets maxim goes, “nobody ever went broke taking trading gains.”
Parabolic Stop and Reverse (SAR)
An alternative approach require more aptitude in technical analysis. Here, we will introduce a less commonly used chart indicator called the Parabolic Stop and Reverse, or Parabolic SAR. The Parabolic SAR indicator is much easier to understand through visuals, so let’s take look at the indicator at work using the EUR/USD:
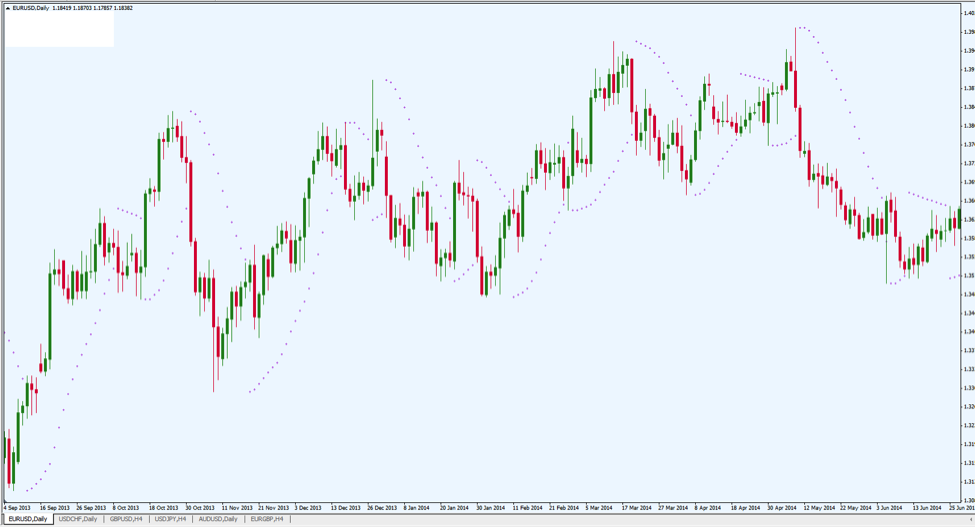
Chart Source: Metatrader
Visually, the Parabolic SAR looks like no other indicator and it might even be a bit difficult to see on the chart. But here we can see purple dots that follow price action and send buying and selling signals in the process. Specifically, buy signals are sent when prices are above the plotted indicator reading. Sell signals are sent when prices are below the indicator reading.
But these signals can also be used in positions that have already been established. For example, forex traders that are in active long positions might want to consider exiting those positions when sell signals are sent. Conversely, those in active short positions might want to consider reversing that stance if the indicator issues a buy signal. This is why the indicator is named the “stop and reverse.”
Let’s look at this chart again with the buy and sell signals identified:
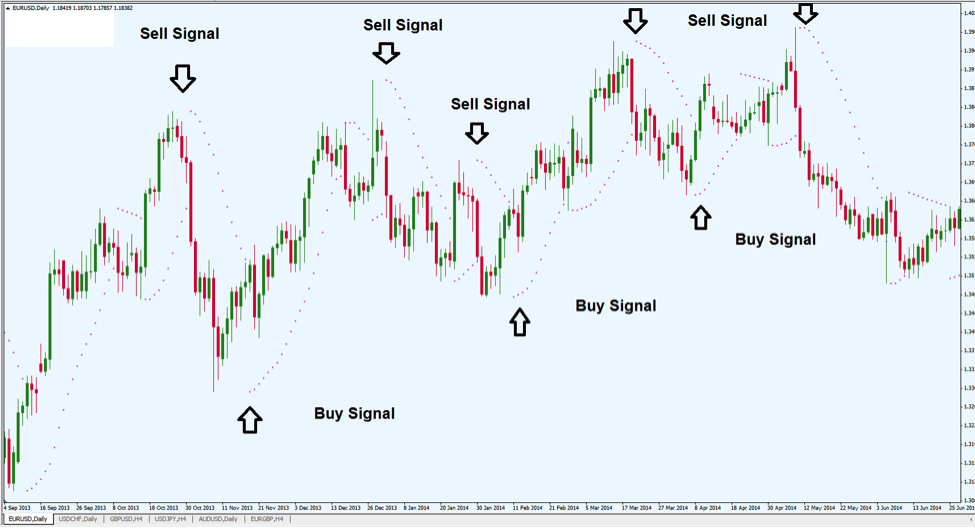
Chart Source: Metatrader
Here, we can see how it looks when the Parabolic SAR sends its buy and sell signals. Let’s pay special attention to the first two signals. The first downward arrow signals an opportunity to sell the EUR/USD currency pair. Assume that this short position was taken and held until a buy signal was sent at the second upward arrow. Here, a forex trader could have capitalized on a price move of roughly 600 pips before there was any indication that the position should be closed. If we look at the differences between the second and third signals (a buy signal and a sell signal, respectively), an even larger move is seen.
With this in mind, it should be understood that the Parabolic SAR is a very powerful tool in terms of the ways it can allow traders to actively manage their positions once established.
Forex Breakouts
A large percentage of forex traders focus on technical analysis and use it as a basis for establishing new positions. To some extent, this makes a good deal of sense because analyzing the currency markets is a much broader task than analyzing the earnings outlook for a single company. Many more factors influence the economic prospects for an entire nation, so one solution for dealing with this is to pay more attention to price charts and using that information to establish forex trades.
There are many sub-strategies that forex traders use when attacking these markets, but one of the most common is the breakout strategy. In this case, forex traders look for chart signals which suggest that currency prices are on the verge of a big move (in either the upward or downward direction). Here, we will look at some of the elements that go into spotting breakouts as well as some of the trade management rules that are typically associated with this type of trading.
The End of a Sideways Market
In order for a breakout to occur, we must first have a sideways, or consolidating, trading environment. Those familiar with some of the basics of technical analysis will understand the trading range — which is where prices bounce back and forth between support and resistance levels with no dominant trend in place. Below is an example of a sideways market with range trading characteristics present:
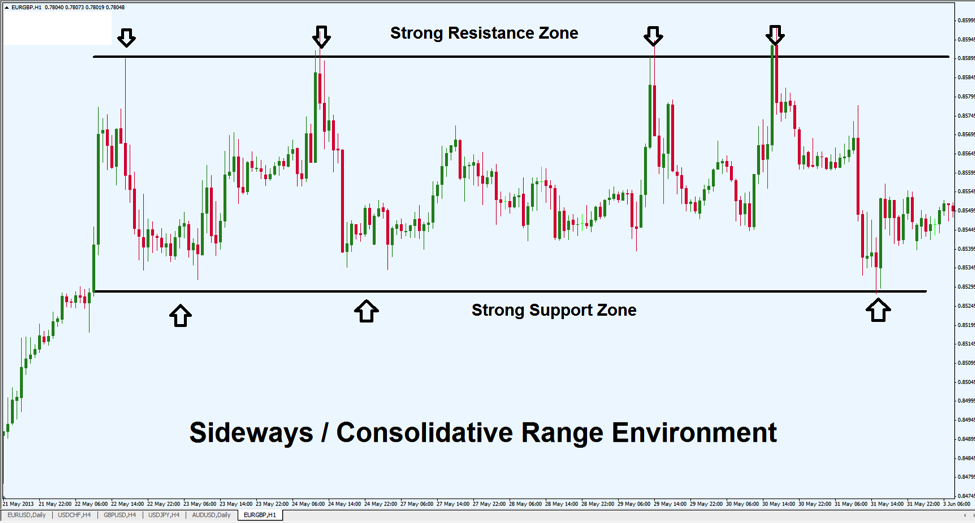
Chart Source: Metatrader
The above chart shows sideways trading activity in the EUR/GBP, which is a currency pair that is often caught in trading ranges. Prices bounce back and forth from the support zone to the resistance zone and no dominant trend is present. Trading ranges cannot last forever, however, and once this trading range breaks down, there are increased for breakouts as the market adjusts to the new directional momentum.
Breakouts Signal New Trend Beginning
When one of these support or resistance levels is breached, forex traders start to position for the beginning of a new trend. The logic here is that market energy was building as price activity was constricting. Once these consolidative ranges break, the momentum that follows is often very forceful. When forex traders are able to spot these events in the early stages, significant profits can be captured when new positions are established in the direction of the breakout.
Let’s take a look at a downside breakout in the EUR/GBP:
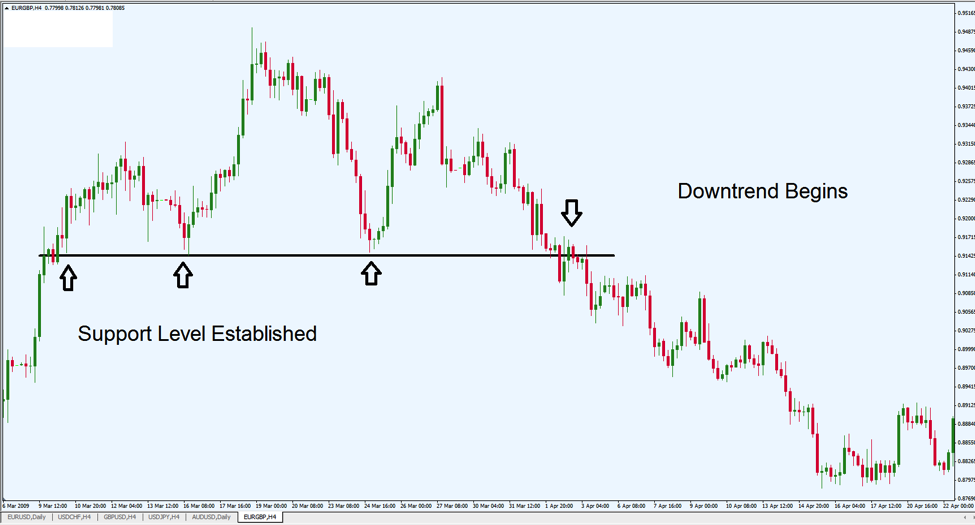
Chart Source: Metatrader
In the chart above, we can see an example of a bearish breakout where prices are trading mostly sideways against a clearly defined level of support. In forex, breakout traders would be looking for an opportunity for new trades as the level of support finally breaks. This event occurs at the downside arrow, which comes in near the 0.9150 mark. Short trades could have been taken here, and roughly 350 pips could have been captured as the GBP strengthened and prices soon fell below 0.8800.
Next, let’s assess a bullish example using the USD/JPY:
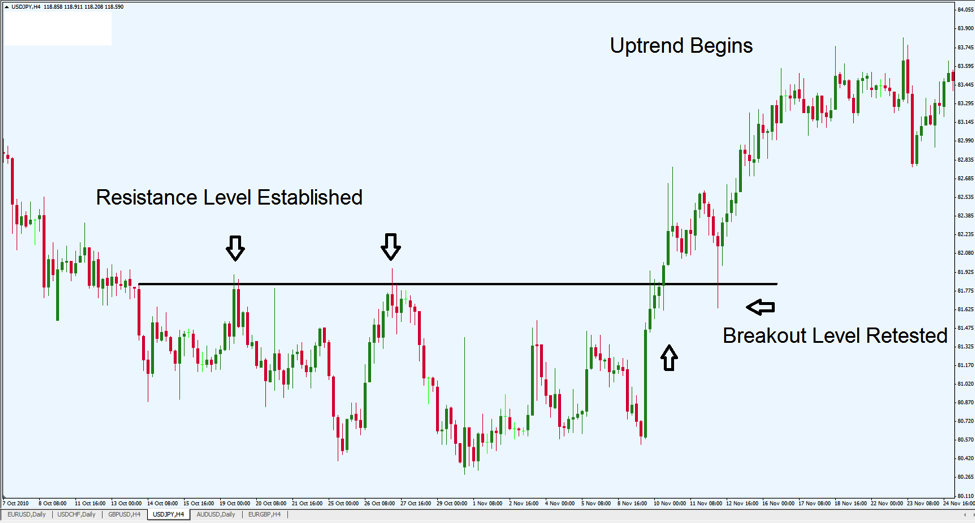
Chart Source: Metatrader
In the chart above, we can see an example of a bullish breakout where prices are trading sideways against a clearly defined level of resistance. Here, breakout traders would be looking for an opportunity for long trades as the level of resistance finally breaks. This event occurs at the upside arrow, which comes in near the 81.80 mark. Long trades could have been taken here, and roughly 200 pips could have been captured as the USD strengthened and prices later rose to the 83.80 region.
An added factor that can be seen in this example is the fact that prices pushed through the critical resistance zone, made a small rally — and then dropped back slightly to retest the area of the breakout. Basic technical analysis rules tell us that once a level of resistance is broken, it then becomes a level of strong support. (Just as a broken level of support will then become a level of strong resistance). In this USD/JPY example, we can see that after the initial bullish breakout prices dropped to test the 81.80 breakout zone. This is shown at the red candle near the sideways arrow. The long bottom wick on this candle shows that prices bounced forcefully out of this area — strong indication that the breakout is valid and that 81.80 will now be viewed as support for the uptrend that follows.