
Futures Advanced
Futures Advanced — What Is The Influence Of Central Banks?
When we look at the financial news media, some of the most market moving events are driven by central bank decisions. Typically, the stated responsibility of any central bank is to maintain price stability and support the upward potential for growth in a country’s economy. But from the point of view of a futures trader, the actions of central bankers can have very different implications.
The true nature of these implications will depend heavily on the type of futures contract that is being traded. Are you focusing mostly on stock indices, commodities or currencies? If so, you will need to understand how the raising and lowering of interest rates will impact each of these asset classes. This way, you will have a better idea of how you should be positioning your trades once an important central bank decision is released.
Stock Benchmarks
When a central bank raises or lowers interest rates, the first place most traders look is at the benchmark stock indices. Central bank meetings are always scheduled well in advance, so in most cases volatility will slow in the days and hours that precede the meeting. This is because futures traders are waiting for the final result before committing to an active position. Prior to any central bank meetings, there will be a great deal of discussion in regard to what is like to happen at the meeting. Will the central bank raise rates, lower rates, or keep the base interest rate steady? There is usually a consensus opinion about what is most likely to happen. But most traders will stay on the sidelines until the final result is made public.
For stock traders, higher interest rates are generally thought of as a negative. This is because higher interest rates tend to weigh on the economic as a whole in making it more difficult to borrow on credit. For individual consumers, this tends to mean fewer large purchases and these types of consumer trends will generally weigh on the ability for corporations to produce increased revenue results. Lower interest rates work in the opposite direction: consumer credit is cheaper, households are able to make more large purchases, and corporate profits tend to be helped by the broader economic climate.
This is useful information for futures traders that are looking to base their positions on the outcome of a central bank meeting. So for example, if the market is expecting the Federal Reserve to cut interest rates, we would almost certainly see big declines in stocks if the Fed surprised the consensus and instead decided to raise interest rates. As a general rule, central bank decisions to raise interest rates send indices like the S&P 500 and Dow Jones Industrials lower. Decisions to cut interest rates send stock markets higher. “No change” decisions might only have a negligible effect on valuations in equities.
Currencies
It might be true that central bank decisions tend to be closely associated with stock markets, but it is the currency market that is most directly impacted by changes in central bank policy.
For futures traders that focus on currency assets, central bank decisions can be great for constructing a long term outlook. Whenever a central bank raises interest rates, it is almost always a positive for the currency in that country. This is because interest rates mean higher yield carry for those holding long positions in that currency. So central bank decisions to raise interest rates will generally lead to an influx of new “buy” contracts for that currency. Central bank decisions to reduce interest rates will generally lead to an influx of new “sell” contracts for that currency.
Commodities
Last, we look at commodities. Those that believe central bank interest rate decisions do not impact commodities as misled, as all of these markets are intimately connected. Changes in interest rates can influence the supply and demand outlook for commodities on a number of different fronts. With an asset like oil, higher interest rates tend to weigh on the demand outlook as companies are going to have a more difficult time spending money on energy products. This activity can lead to excessive storage supply and this dampens the potential for later bull rallies. Lower interest rates tend to support the demand outlook and send oil prices higher.
In all, central bank decisions should not be overlooked by futures traders. Not all markets are impacted in the same way once these decisions are released. But there are some predictable tendencies that are usually seen, and these events can be used as a basis for new positioning in short term and long term futures contracts.
Futures Advanced — Understanding The Earnings Season
In order for futures traders to successfully navigate the market, it is essential to understand the driving factors behind changes in market price. Accurate forecasting in these areas is essential in order to capture profits in active futures positions. The strength or weakness in the underlying value of any stock depends heavily on a company’s ability to generate sustainable earnings revenue. To gauge the trends seen here, futures traders will typically turn to corporate earnings reports, which give the market explicit details on a company’s earnings performance over the previous quarter.
Think of these reports as a kind of “report card” that shows how well a company is likely to perform in the months ahead. Those looking to trade futures contracts in stock assets will need to tailor their long term outlooks on the performances of the companies being traded. So here, we will look at the factors involved in understanding the corporate earnings season so that we can gauge the ways futures trades can be constructed once the information is made public.
Reports Released In January, April, July, and October
All corporate earnings reports are scheduled well in advance, and most of those reports are released at roughly the same time. Generally speaking, earnings season takes place one to two weeks following the final week of each quarter. Quarters are separated in December, March, June and September, so most companies will report their revenues toward the middle of January, April, July, and October. These periods mark the start earnings season and will include the earnings performances of most publicly traded companies.
Unofficially, the earnings season begins with the quarterly release given by Alcoa Aluminum Corp. (stock symbol: AA). This stock is a significant component of the Dow Jones Industrials index, and the company itself is often thought of as an important gauge of the health or weakness in the broader US manufacturing sector. For this reason, Alcoa tends to receive a good deal of market attention once this release is made. Additionally, this release will often lead many analysts to revise their outlook for how the stock market as a whole is likely to report earnings.
Impact On Benchmarks
Most futures traders do not focus on individual stocks, but it is almost always a good idea to know how the biggest name companies have performed during the previous quarter. This is especially helpful for those that are looking to establish futures contracts in important benchmark indices like the S&P 500, the Dow Jones Industrials, and the NASDAQ. For these reasons, the strengths and weaknesses seen during earnings season itself can be some of the best indicators for whether futures traders should be establishing buy (long) or sell (short) positions in these indices.
It is also important to remember which index a specific company falls into. For example, Microsoft (MSFT) earnings will have a much more direct impact on the S&P 500 than it will on the Dow Jones Industrials — because MSFT is part of the S&P 500 index. At the same time, positives or negatives seen in a company like Alcoa Aluminum (AA) will most closely impact the Dow Jones Industrial average. So it is important to have a strong sense of a benchmark’s components before placing any futures trades using that index. Lists showing the component stocks in any stock benchmark index can be found easily through a web search.\
Increased Volatility
In addition to the valuable information earnings season provides for futures traders in the central stock benchmarks, it is also important to remember that this time period is also associated with increased price volatility in most asset markets. This is because earnings season causes many analysts to start revising their outlook based on the new revenue information that is being made public. For example, significant changes seen in oil companies could start to influence energy prices in the same way that changes in financial stocks could start to influence valuations in the US Dollar. Overall, it is important to assess the significance of each corporate earnings release in terms of which assets it is most likely to influence. This will help you to structure new trades based on the information as it is made public.
Futures Advanced — Momentum Trading in Futures
Futures traders that are looking to define a technical analysis strategy will first need to determine whether or not they want to side with the broader momentum that is visible in the market. There are advantages and disadvantages present in this type of approach, so it is important to assess whether or not this type of trading style is actually going to meet your goals and developing your skills as a trader. Here, we will look at some of the specifics seen in momentum trading and then introduce some technical indicators that will allow you to spot new momentum trading opportunities as they arise.
Pros and Cons
When we look at some of the pros and cons associated with momentum trading, some interesting features come to light. Specifically, advantages can be found when futures positions are taken in-line with what the rest of the market is doing. If the majority of the market is buying an asset, prices will rise. If the majority of the market is selling an asset, prices will fall. As this occurs, market momentum is generated and trades taken in the same direction can benefit from the fact that it is more difficult for prices to reverse in the opposite (unfavorable) direction.
On the downside, it must be remembered that futures markets can never travel in one direction forever. At some stage, momentum will start to wane, and those that bought in too high (in an uptrend) or too low (in a downtrend) can often be caught with their hands tied in a losing position.
Momentum Indicator
For this reason, it is generally a good idea to have a solid set of momentum indicators that can be used to determine whether or not the required momentum is still present in the market. If it is not, those positions should not be taken. Some of the most popular choices in this area include the aptly named Momentum indicator — which is sometimes referred to as Rate of Change (ROC) — and Stochastics.
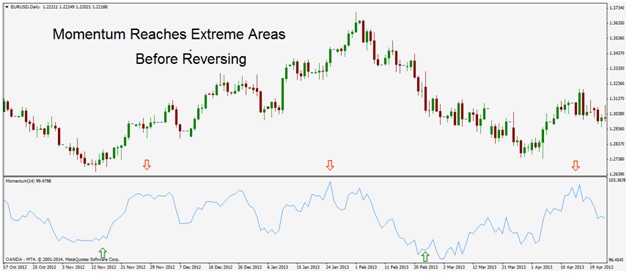
Chart Source: Metatrader
The Momentum indicator measures the rate at which an asset’s price is rising or falling over time. In the chart example above we can see several instances where price momentum has reached an extreme point before reversing. Once the momentum reading hits extreme levels, these types of trades should be avoided. Instead, look to enter into trades while momentum is still building. Visually, this can be seen when the Momentum indicator has moved above or below the mid-point.
Stochastics
Next we look at the Stochastics indicator, which uses much of the same price information but produces different types of signals.
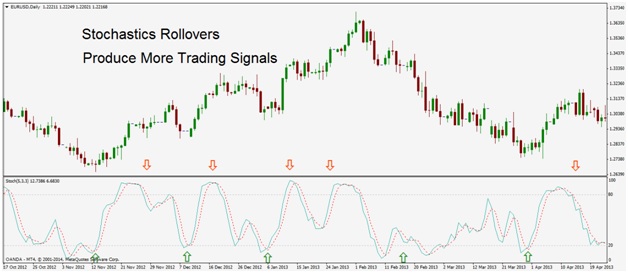
Chart Source: Metatrader
In the chart above, we can see the Stochastics indicator plotted along the exact same price action in order to see the differences in the signals. When using the Stochastics indicator, buy signals are sent when market momentum drops below the 20 line, and then starts to rise back above that line. Sell signals are sent when market momentum rises above the 80 line, and then starts to fall back below that line.
One interesting different to note here is the fact that the Stochastics indicator sends many more signals than the simple momentum indicator — even though the price activity itself remains the same.
Which Momentum Indicator Is Best?
Once you decide to use momentum strategies as the basis for your trading, you will probably soon ask yourself which indicator is best. Unfortunately, there is no clear cut answer to this question. The answer will instead depend on which of these tools most closely matches your trading style. If you are looking to enter into a larger number of trades, the Stochastics indicator will probably be the more attractive option. But if you are looking for fewer signals that have a higher rate of accuracy, the Momentum indicator — or ROC — might be preferable.
In any case, these indicator tools will help to give you a better sense of where the real momentum lies within the broader market. This can be useful information when looking to construct trades with a better than average risk-to-reward ratio.
Futures Advanced — Futures Spreads
When developing a futures strategy, most traders tend to focus on individual markets. For example, some futures will place most of their attention on the benchmark stock indices while others might choose to deal mostly with commodities or currencies. But for those with an advanced perspective, alternative strategies should be considered. Specifically, the futures spread trade will allow you to capitalize on your knowledge of individual markets and pose one asset against another. Here, we look at the specifics of this advanced futures trading technique.
What Is A Futures Spread Trade?
A futures spread is a trade that involves the simultaneous buying and selling of two futures contracts in a correlated market. For example, a futures trader might consider taking a long position in the e-mini S&P 500 and a sell position in the e-mini Dow Jones Industrial index. These two assets are highly correlated because they are both stock market benchmarks in the US. Other examples here could include:
● Long Gold / Short Silver
● Long Corn / Short Wheat
● Long Euro / Short US Dollar
As long as you are taking one buy position and one sell position at the same time, you will be taking an active stance on the relatively performance of both assets. Each asset is also referred to as a “leg.” So, in the example above, each position would be comprised of two legs — one long contract and one short contract. This qualifies as a futures spread trade.
Futures Spreads: The Underlying Logic
So, why exactly would a futures trader want to consider a spread trade?
Correlated markets tend to move in the same direction, but at different rates of speed. This means that while the underlying trend in similar assets might be bullish or bearish, external factors will keep those assets from rising or falling at exactly the same rate. When traders are able to accurately forecast which asset is likely to rise or fall faster than the other, those traders can capitalize on the difference.
For example, if our spread trade involves buying the December Gold contract and selling the December Oil contract, profits can be made when the price of gold rises more quickly than the price of oil during that period. This does not necessarily mean that the price of oil has to decline from the time the oil contract is initially sold. All that needs to happen is that the price of oil does not rise at a rate faster than any bullish activity seen in gold. So, in theory, the price of oil could trade sideways or even positively and the trade could still make money. The key here is for the futures trader to accurately forecast which asset will rise or fall faster than the other.
Types Of Spreads
Additionally, it should be remembered that futures traders are not limited in the types of spreads trades that can be implemented. Specifically, this means that there are two main types of strategies that can be implemented using this approach: Intra-Market spreads and Inter-Market spreads.
In an Intra-Market spread, a trader can actually enter into two futures contracts using the same asset. An example here might be seen when a trader simultaneously buys a December Corn contract while selling a January Corn contract. A strategy like this might be implemented if the trader believes that Corn will rise in the short-term but then start to decline once the longer-term trend sets in.
In an Inter-Market spread, a trader will enter into two futures contracts in two different markets. An example here could be seen when a trader simultaneously sells a December S&P 500 contract while buying a January S&P 500 contract. A strategy like this might be implemented if the futures trader believe that the S&P 500 will soon see declines but then recover the following month.
Trading Advantages
When trading using this type of strategy, there are some added advantages that should be considered. First is that futures spreads can help you to reduce the volatility that is typically seen when traders take only one position at a time. This approach can leave you trading account more vulnerable if wild price swings are seen in the market. Second is that since markets tend to move forward in trends, the spreads approach can help you to capitalize on the broader momentum that is visible in the market. Third is that spread trading helps to improve risk to reward ratios, because there is less chance that the market will suddenly reverse in an unexpected direction.
Futures Advanced — Contrarian Trading in Futures
Futures traders that are looking to define a technical analysis strategy will first need to determine whether or not they want to side with the majority of the market. Those that opt against this mindset are often referred to as contrarian traders in the futures market. There are clear advantages and disadvantages present in this type of approach, so it is important to assess whether or not this type of trading style is suitable for your individual trader profile. Here, we will look at some of the specifics seen in contrarian trading and then introduce some technical indicators that will allow you to spot new contrarian trading opportunities as they arise.
Pros and Cons
When we look at some of the pros and cons associated with contrarian trading, we again must look to where the majority of the market is placing their position stance. Prices rise when the majority of the market is buying, prices fall when the majority of the market is selling. Contrarian traders are always on the lookout for opportunities in times when these trends are starting to fade. These market swings allow contrarian futures traders to place their positions in the opposite direction. When this is done successfully, these traders are able to truly “buy low and sell high,” which is something that tends to be the goal of most futures traders.
Great opportunities for profits can be captured when contrarian strategies are implemented. But is is important to remember that there are downsides as well, as fighting against the markets broader momentum is sometimes akin so trying to stop a moving train with your bare hands — much easier said than done. This can often lead to your positions being stopped out if the market’s original trend starts to re-assert itself.
Contrarian Indicators
For this reason, it is generally a good idea to have a solid set of contrarian indicators that can be used to determine whether or not the time is ripe to start taking contrarian positions. Here, we will look at two of the most popular choices in this area — Trendline Breaks and the Commodity Channel Index (CCI).
In the first chart example, we can see two instances of a trendline break, which indicates that the previous trend has run its course and is ready to reverse:
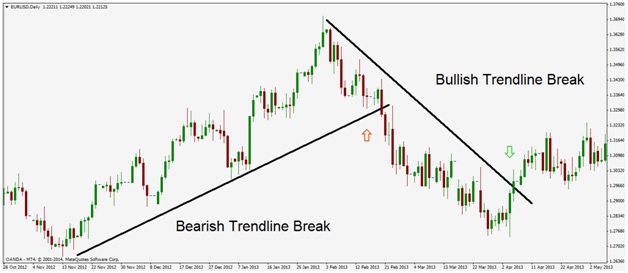
Chart Source: Metatrader
Trendline breaks give contrarian futures traders highly valuable information that can be used to place new positions in the market. When trend lines break, it is an early indication that the initial trend is over and it is time to bet in the other direction. In the chart’s first price move, a clear uptrend is in place. But contrarian traders would be looking for clues that this uptrend is over, and this signal finally comes at the red arrow. Here, traders could establish short sell positions in anticipation of a new run lower.
Those short positions could then be held until a trendline break is seen in the other direction — a new indicator that the downtrend is over. Once this is seen, futures traders adopting a contrarian strategy could buy the asset in anticipation of another bull run higher.
Commodity Channel Index (CCI)
Next we look at the Commodity Channel Index, which looks to gauge the level of bullish or bearish sentiment that is currently present in the market.
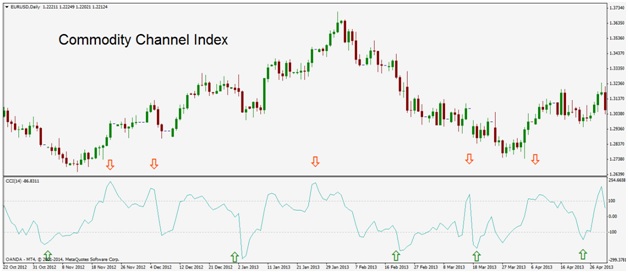
Chart Source: Metatrader
In the chart above, we can see the CCI indicator plotted along the same price action. This indicator works on a scale that runs from +100 to 0 to -100. Bullish sentiment starts to build once the indicator falls below -100 and then turns above that indicator line. This is the signal contrarian traders a watching for in order to go long on the asset. Bearish sentiment starts to build once the indicator rises above +100 and then turns below that indicator line. This is the signal contrarian traders a watching for in order to go short on the asset.
Which Contrarian Indicator Is Best?
If you are ready to start testing contrarian strategies in the futures market, a common question asked is which contrarian indicator works best in active trading. When we look at trendline breaks and the CCI indicator, there is nothing wrong with using both strategies at the same time. For example, very strong buy positions can be taken when the CCI is turning upward from below -100 as a bearish trend line is breaking. Conversely, strong sell positions can be taken when the CCI is turning downward from above +100 as a bullish trend line is breaking. These are the types of signals futures traders are watching for when looking to establish new contrarian positions.
Futures Advanced — Backwardation and Contango
The futures market is full of seemingly complicated terms with funny names. These terms can seem difficult to understand at first, but once we understand the basic logic behind the terminology it becomes much easier to visualize how these ideas work in active markets. Two of the most frequent (and unique) terms that fall into this category are backwardation and contango. These are words that might sound very exotic at first, but actually explain normal trends in the futures market.
Normal And Inverted Markets
First, we must understand the difference between “normal” and “inverted” market curves. Under normal conditions, asset prices tend to rise over time. In an inverted market condition, asset prices are expected to fall. These events can be seen in the chart below:
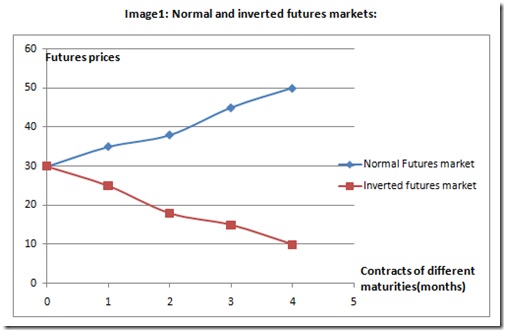
Chart Source: Edupristine
The blue line shows normal market conditions, where the front month futures contract is cheaper than the futures contracts that follow. The red line shows inverted market conditions, where the front month futures contract is more expensive than the futures contracts that follow. Remember, these contracts all involve the same underlying asset.
Contango And Backwardation
Now, we can understand contango and backwardation. Consider the next chart graphic:
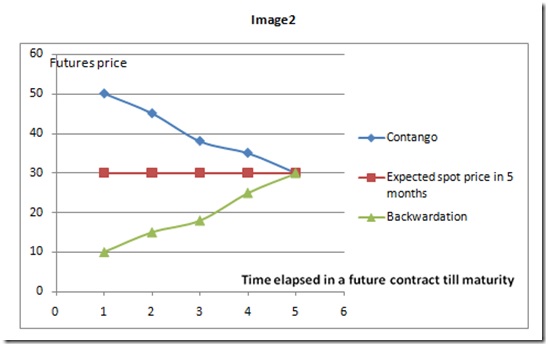
Chart Source: Edupristine
Futures markets are said to be in contango when futures prices are above spot prices (the price at which the asset could be immediately bought or sold — shown by the red line above). This is shown by the blue line. Futures markets are said to be in backwardation when futures prices are below spot prices. This is shown by the green line.
Markets are generally in contango when there is a large supply of the asset. This creates a bearish outlook and leads to falling prices over time. Contango environments are favorable for those holding short positions (selling a futures contract). Markets are generally in backwardation when there is a tight supply of the asset. This creates a bullish outlook and leads to rising prices over time. Backwardation environments are favorable for those holding long positions (buying a futures contract).
Trading Examples
Contango and backwardation scenarios are created changes in the relationship between the price of a futures contract and the spot price for the asset. The spot price is often referred to as the “basis,” as the price of the futures contract will always be forced to converge with that price over time.
Consider the following example:
Assume that oil futures prices are trading above the accepted spot price. Traders then might consider shorting a futures contract in oil in anticipation of falling prices. This is likely to occur, given the fact that prices will need to drop in order to “converge” with spot prices at time of contract maturation. This tendency to short the market creates a larger supply of futures contracts in oil, sending prices lower.
At the same time, spot traders are more likely to buy the asset, as it is trading cheaply relative to what futures prices are showing for future market expectations. This causes the spot price to rise, and eventually converge with valuations in futures markets. This scenario would be an example of contango.
If we were to look at a scenario of backwardation, every element would move in the opposite direction. Here oil futures prices would be trading above the accepted spot price. Traders then might consider going long on a futures contract in oil in anticipation of rising prices. Prices will need to rise in order to converge with spot prices at time of contract maturation. This tendency to go long the market creates a declining supply of futures contracts in oil, sending prices higher.
At the same time, spot traders are more likely to sell the asset, as it is trading at expensive levels relative to what futures prices are showing for future market expectations. This causes the spot price to fall, and eventually converge with valuations in futures markets.
In these ways, futures traders can use contango and backwardation in order to organize a positioning stance. But it should be remembered that these environments can (and will change) over time. For these reasons, traders will always need to remain cognizant of where futures prices are trading, relative to spot prices.
Futures Advanced — Avoiding Rookie Mistakes
Now that you have a basic understanding of how the futures market works, you are ready to start putting that knowledge into practice. But in order to do this successfully, you will need to avoid the mistakes that are generally experienced by rookie traders. The mistakes take a few different forms, but there are some common themes that will need to be avoided. This will help you to define your futures trading outlook and keep your account balance healthy now that you have reached expert trader status.
Establish Your Trading Plan
Inexperienced traders will often put money into the market without having a clearly defined trading plan in place. Unfortunately, this quickly leads to losses because there is no logic or reasoning behind your positions that can help turn the odds into your favor. This essentially turns your positions into a “coin flip” or something akin to gambling in Las Vegas.
Experienced traders have a sense of where their strengths and weaknesses lie, and have a clearly defined outlook before any active positions are taken. Are you a technical analysis practitioner or a fundamental trader? Are you going to base your trades on an important new event or on a trend momentum strategy? Do you want to base your positions on long-term timeframes or short-term timeframes? These are some of the questions you will need to have answered before any real money is put into the market.
Avoid Using Excessive Leverage
The next major problem is the use of excessive leverage. Inexperienced traders see only Dollar signs and put far too much money on their futures positions. You will never corner the market in a single trade, so it is best not to try. Successful futures traders look at their daily routines as a marathon, rather than a sprint.
Leverage is a powerful tool that can help you to maximize your positions and take advantage of small fluctuations in market price. But excessive leverage opens you up to excessive risk, and this can quickly deplete your trading account balance. It is not necessary to view the market in this manner, and those that take a more prudent approach (and limit leverage levels to 5:1 or 10:1) tend to post much better performances over the long run.
Focus On Risk, Not Reward
Those that overuse leverage are generally viewing the market in ways that are fundamentally flawed. Specifically, this means focusing on the potential rewards in any position rather than the associated risk. But the unfortunate reality is that it is the losses that will cripple your trading account, not your gains. So this is where the majority of your focus should be placed.
In practice, this means that you should know exactly how much money is being risked in any active position. No futures contract should be bought or sold without the use of a stop loss. There will be many cases where the market works against you and your stop loss is hit. But as long as you can limit those losses to a reasonable level, you will live to trade another day.
Stick To Your Original Trading Parameters
Last, expert traders generally argue it is essential to stick to your original trading plan. Inexperienced traders will often change their position parameters (ie. moving a stop loss farther away from the current price) if the market starts to move in an unfavorable direction. This is a recipe for disaster, as this approach usually leads to larger than expected losses.
Always remember that there must always be a reason that you took the trade in the first place (see common mistake #1), and that original rationale must be honored even if the market starts to turn in the wrong direction. Trading can get overly emotional when losses are accumulating, and this can get in the way of your ability to appropriately manage your position. For these reasons, it is generally a better idea to stick with your original plan (stop losses, profit targets, etc).
Futures Advanced – Algorithmic Trading
Over the last decade, we have seen major changes in the ways futures traders implement their trades. Online broker platforms have made it very easy for traders to access the market at any time from the comfort of their own homes. But this rise in computer technology has also influenced trading strategies themselves, and many traders have started to buy and sell with real money while using automated strategies.
These computer-based strategies are also referred to as algorithmic trading, where sophisticated mathematical formulas are used to construct new ideas for placing buy/sell orders that guide trading decisions in the futures market. But while these strategies come with some significant advantages, there are also some important risks that must be considered before any real money futures trades are placed.
What Is Algorithmic Trading?
So what exactly is algorithmic trading and how does it work? Unfortunately, there is no single approach that can be quickly explained — and the number of available strategies is far beyond the scope of this article to conclusively explain. But many of these strategies will look at factors like market momentum, historical averages, and trend direction as a basis for constructing a trading bias and implementing new positions.
For example, let’s say that the price of corn futures has fallen 10% below its 100-day moving average. Traders could set up a trading robot — also known as an Expert Advisor, or EA — that will automatically buy a futures contract in corn once these conditions are met. Predetermined values like position size, leverage, and stop loss levels can be tailored to your specific style and approach. These robots can even close your trade automatically once a certain amount of profit has been captured.
Pros And Cons
Of course, automated trading carries with it a unique set of benefits and drawbacks. On the positive side, software-based strategies will allow traders to search for new trading opportunities even when not in front of a trading station. EAs are able to scan all available markets and find scenarios that match your favorite trading strategy. It would be essentially impossible for a human being to monitor all available markets at all hours of the day. But this approach is an easy possibility for those that are willing to keep a PC running at all times of market operation.
On the downside, there might be circumstances where your EA opens a trade that you might have avoided if you were actively monitoring your trading station. This could lead to potential losses that you might have avoided on your own. For these reasons, it is critically important to keep your position sizes small when using automated trading software. This way, your gains and losses should equalize over time, rather than wiping out your entire trading account with a single position.
How To Get Started
There are many different ways to get started in algorithmic trading, and there is a broad sea of advertisements that claim to have the “holy grail” of automated strategies. As a general rule, if it sounds too good to be true — it probably is. So always be skeptical of systems that claim to grant access to 100% or 200% gains in a short period of time.
A better approach is to side with trading systems that have been backtested by other traders and shown to produce strong results over time. One of the most popular trading platforms for those using automated strategies is MetaTrader, which is a highly customizable piece of computer software capable of running several EAs at a time. Additionally, there are many backtested and reviewed Expert Advisors that can be found through a simple web search. One good resource for free (and tested) EAs can be found at the MQL5 website.
There are many different options available for those looking to get started in automated algorithmic trading. But, most importantly, futures traders must understand the advantages and drawbacks in this market approach as there is always risk involved when real money is put into trades that are monitored solely by computer programs.
Futures Advanced — Advanced Tools In Technical Analysis
Those looking at trading the futures markets from a chart perspective will eventually grow past the use of simple trends, trading ranges, and historical support and resistance levels. Indicators and Oscillators can also be highly useful in this area, but there are additional tools available for those that have mastered these more basic strategies. Two of the most common choices here can be found in Fibonacci Retracements and Moving Average Crossovers. These chart events can help those trading futures contracts to determine when it is time to buy and asset, and when it is time to sell it.
Fibonacci Retracements
Fibonacci Retracements are based on the calculations of a 13th century Italian mathematician and have been a feature of the financial trading markets for centuries. Specifically, these calculations help to identify areas where prices might bounce or fail, relatively to the bullish/bearish trends that preceded. Consider the Gold chart below:
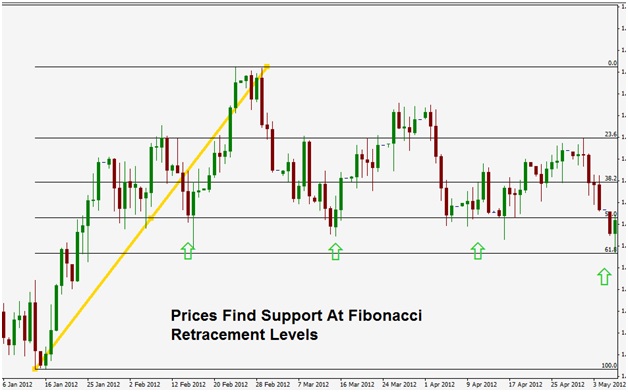
Chart Source: Metatrader
To plot a Fibonacci Retracement, we first find a clearly definable price swing. This is shown using the yellow line in the chart above. The move shown here is bullish, and then once prices start to fall back downward, many traders will start to expect seeing prices find support at the key retracement levels (38.2%, 50%, and 61.8%). In this chart, we can see prices consistently find support at the 50% retracement, which is essentially the area where markets have given back roughly half of the initial rally. Later in the chart, we can see prices find support at the 61.8% Fibonacci level.
These retracement areas can be plotted in the other direction, as well. In these cases, futures traders could look for resistance points using the same percentage retracement levels. In short, these retracement areas can be used to place new buy orders while markets are in an uptrend and sell orders when markets are in a downtrend. Fibonacci support and resistance zones are relatively easy to plot and can be used on conjunction with other chart analysis techniques in order to define an advanced trading strategy.
Moving Average Crossovers
Next, we look at the Moving Average Crossover, which is a good way for futures traders to identify where market momentum might be heading next. In the chart below, we will look at an example of a bearish crossover:
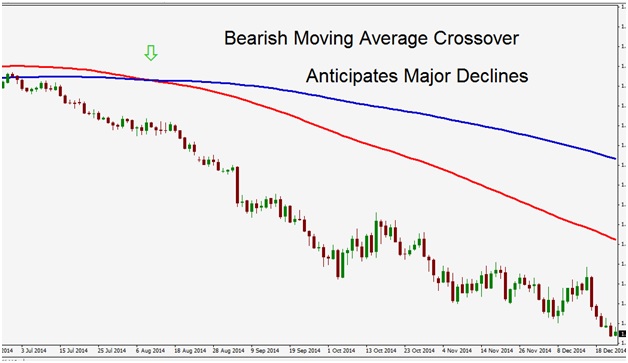
Chart Source: Metatrader
In this example, a 100-day moving average is plotted in red along with a 200-day moving average plotted in blue. Initially, prices were in an uptrend and this sent the 100-day moving average above the 200-day moving average. This is a bullish chart indicator, but once this changes, sell positions should be considered. At the green arrow, we can see this occur as the faster moving average finally crosses below the longer term moving average.
This is a strong signal suggesting that the initial bull run is over in this asset and that futures traders should start to consider selling their contracts. Here, we can see that prices ultimately obey this signal and post immense declines after the bearish crossover was seen.
Of course, crossovers could also be bullish and this would become visible if the faster moving average (in this case, the 100-day moving average) were to cross above the longer term moving average. If this is seen, it is a signal that market momentum has turned bullish and that it is now a good idea to start considering long positions in futures contracts related to that asset.
Combining Indicators
Both Fibonacci Retracements and Moving Average Crossovers can be powerful tools in helping futures traders identify a trading bias in the larger market. But at the same time, it should be remembered that both of these tools can be implemented at the same time, as well. Specifically, if we were to see a bullish crossover just as prices are hitting a 38.2% Fibonacci Retracement support level, we would have two individual reasons to buy into that asset.
Essentially, what you are looking for as a technical trader is a broader agreement between your signals. As long as your signals agree on the bullish (or bearish) scenario, it becomes much easier to pull the trigger on a new live trade.
Futures Advanced — Contract Maturities And Rollover
One of the things that separates the futures markets from many of the more commonly used “buy and hold” investment strategies is the fact that all futures contracts are tied to a specific length of time. When entering into a futures contract, you are making a commitment to buy or sell a specific asset at a set time in the future. This time frame is also referred to as the maturity, or expiration period. But just because a futures contract must end, it does not mean that you are actually forced to exit your position.
Rollover Trading Example
Let’s assume that you are bullish on the Gold and you express this position by buying a December Gold futures contract at the price of $1200 per ounce. Markets move back and forth around that number, but finish the month at $1195. But you still believe that gold prices will run higher, so you sell the original December contract and buy a new contract in February Gold. This would then allow you to maintain bullish exposure on the asset while giving the market enough time to run its course.
This is a relatively common practice in the futures markets and is generally referred to as “rolling over” an active position to a later time period. If you are currently selling a futures contract (in any available asset) you will need to “buy back” that contract prior to expiration and then sell another contract in the same asset but with a different expiration period.
Added Factors To Consider
In many cases, there will be a small difference between the prices of these two contracts, which is not entirely surprising given the fact that they will encounter different delivery periods. This difference is referred to as the forward discount or forward premium, depending on which contract is more expensive. Some traders will refer to this difference as the “spread” between both contracts. Terminology aside, it is important to notice whether there is a premium or discount for the following futures contract, as any significant differences could make it difficult to justify rolling over the position (in cases where the extra costs is simply too high). If the added costs unnecessarily diminish your potential for trading returns, it might be better to simply exit your position and wait for another opportunity.
In cases where you decide to rollover your position, it is best to execute the buy and sell orders for both contracts at the same time. When this is not done, the futures trader is said to be “legging” into the new position – and this is typically done using a spread order. When a futures contract is deliverable (which is the case for most futures contracts), it is best to roll the position before the initial notice day.
This is because it is often much more difficult to roll a position once you have entered into the delivery period. But in any case, positions must be rolled prior to the cash settlement date that marks the last trading day of the contract. If this is not done, you will be committing to the position outcome, even if you intended to do otherwise. Most futures brokers have an easily accessible calendar that will allow you to note the schedule for each of these dates.
Situations To Avoid
When you are considering rolling over on your futures contract, it is important to make sure that the next contract is trading with sufficient liquidity and that the price action shown in the chart closely resembles your original contract. Commodities in many agricultural products can experience violent price swings if outside factors like weather and farm productivity limit supply. Short-term fluctuations can also exist in assets like oil, so it is important to monitor the price activity that is seen in your next chosen contract.
In any case, rollover in futures contracts can allow you to keep your positions active and avoid dealing with the immediate consequences of short term price fluctuations that do not match your broader outlook. In this way, rollover can be a valuable tool in helping you limit potential losses in an active futures position.