
Forex Basics
Exotic Currencies
By nearly all measures, the foreign exchange market is one of the most diverse markets in the world. This is because the forex market encompasses the currencies of every nation in the world. Some currencies are more commonly traded than others, and we have included a list of the “major pairs” in the forex market in a previous article.
But this market is much broader than four simple currency pairs and here we will look at some of the less commonly traded instruments, also known as the exotic currencies. There are some benefits and drawbacks to be seen when trading in these currencies, so it is important to exercise some degree in caution in these areas when trading with live money.
Available Selections
Those looking to trade in the major forex pairs will never have any trouble finding a broker that has them on offer. But not all brokers give access to the exotic currencies. Some examples in this category include:
- Singapore Dollar (SGD)
- Russian Ruble (RUB)
- South Korean Won (KRW)
- Thailand Baht (THB)
- Mexican Peso (MXN)
- Indian Rupee (INR)
- Hong Kong Dollar (HKD)
- South African Rand (ZAR)
In general, these currencies will be paired with one of the majors when brokers to choose to make them available to traders. So, if you are looking to trade any of these exotic currencies, you will generally need to pair it with the US Dollar (USD) or Euro (EUR) in order to take an active position.
The list above is by no means exhaustive — indeed, it could include every currency in the world. But for those looking to start trading in the exotics, these are some of the choices more commonly available through retail forex brokers.
Decreased Liquidity
Since these currencies are much less commonly traded, it is more difficult to find active buyers and sellers at all market price levels. In market jargon, this is referred to as “low liquidity,” and it generally leads to pronounced price volatility when compared to the major currency pairs. Low liquidity and high volatility is a double-edged sword: it can quickly lead to significant gains or significant losses with relatively little prior notice. So this is something that will need to be considered before any real-money positions are taken in these currencies.
Increased Trading Costs
Another factor to consider is the increased trading costs that are associated with these forex trades. When a currency is less commonly available in the market, it almost always costs more to gain access to that currency. Trading costs in the forex market are also referred to as “spreads.” And when we compare the average spread costs in a major forex pair to those seen in an exotic currency pair, it quickly becomes apparent that the added premiums here will adversely impact your overall profitability within the trade.
Potential Benefits and Advantages
But this does not mean that the exotic currencies should be avoided entirely. In fact that are some benefits in these areas for those with a longer term trading view. Specifically, the exotic currencies tend to move in much more clearly definable trends. This is because there tends to be less publicly available information on these economies, so there are fewer changes in market bias when the majority of the forex trading community is looking to establish bullish or bearish positions. Additionally, many of these currencies are associated with very high interest rates, and this can help traders to add some yield return to their positions. This can help to offset — or even remove — some of the added broker costs that are associated with entries in the exotic currencies.
In all, the trading in peripheral forex pairs offers some interesting drawbacks and benefits. Because of this, they should be considered as part of your overall approach. But it is important to remember that these exotic currencies are much better suited for longer term positions, rather than as part of a day trading outlook that is shorter term in nature.
Fundamental Analysis In Forex Trading
When conducting market analysis, there are generally two approaches taken by forex traders: fundamental analysis and technical analysis. In technical analysis, forex traders assess price charts in order to determine where specific currencies might be headed next. Fundamental analysis is much broader in nature. Here, the analysis requires an assessment of the underlying economic factors that most directly influence the assets in question.
Of course, it is nearly impossible to assess all of the relevant factors that might change market valuations for a currency. So one of the most critical tasks of the fundamental analyst is to “separate the wheat from the chaff” and focus solely in the market events that are most important.
Economic Data and Central Banks
Some of these events include the release of macroeconomic data and interest rate decisions by central banks. Any good fundamental analyst will consult an economic calendar before any trades are placed, as this will be the best indicator of when market volatility is likely to increase. Economic data reports like monthly jobs numbers, inflation, and manufacturing productivity will often lead to an influx in new market orders as traders change their outlook and react to the new information. For these reasons, it is always necessary to have some idea of when these reports are released so that you can avoid getting unnecessarily stopped out of your trade at a loss.
Additionally, fundamental traders will need to remain cognizant of which central banks have scheduled their meeting in the coming days and weeks. Central bank policy is critical for understanding where a specific currency is likely to be headed over the long term, as this is the best indication of where interest rates are likely to be increased or decreased. Higher interest rates are supportive for currencies because it means that it will be more expensive to borrow that currency. Lower interest rates are negative for currencies because it means that there is less incentive to hold that currency for extended periods of time. Less incentive means less demand and higher supply, and this is an environment that generally leads to lower market valuations.
Oil Importing Countries Impacted By Oil Prices
Of course, there are many other factors that must be considered by traders using fundamental analysis. Assets like oil tend to be critical, as manufacturing productivity depends heavily on the changes seen in energy markets. For example, Japan imports nearly all of its oil supplies from foreign countries. So when oil prices rise, it means that it will be more expensive for Japan to buy the energy supplies that it needs to run the economy at large. Currency traders could then use this information (rising oil prices) as a basis for selling the Japanese Yen. This would be one way that a forex trader might tailor his outlook and express that view in an active currency position.
Alternatively, Canada has the second largest supply of known oil reserves in the world (behind only Saudi Arabia). This means that higher oil prices would actually contribute significant benefits to the Canadian economy, as oil refiners will then be able to charge much higher prices for their assets. When oil prices rise, forex traders could then use that information as a basis to buy the Canadian Dollar.
Hypothetically, forex traders could combine the negative outlook in Japan with the positive outlook for Canada in structuring a real-time trade. Forex traders could buy the CAD/JPY currency pair on the expectation that higher oil prices will send the CAD higher and the JPY lower. Of course, this outlook would be reversed if oil prices were declining. This would mean it might be wise to take short positions and sell the CAD/JPY currency pair.
Combining Events
These are some of the factors involved when a fundamental analyst is looking to establish a stance on the market and execute a trade. It is generally a good idea to have more than one fundamental argument for buying or selling a currency, as this increases your chances of success and could lead to more forceful market moves down the line. In the example above, long positions in the CAD/JPY that were based on higher oil prices would benefit even more greatly if there was a general expectation that economic data in Canada was improving or that the Bank of Canada was expected to raise interest rates.
How To Read A Forex Quote
Forex markets have risen fast in popularity over the last few years, but many individual traders are still intimidated when they look at some of the simple mechanics of the forex pairs themselves. But when we break down the components of a forex quote, these issues are quickly solved as things become more familiar through regular trading activities. A forex quote is different from just about every other trading vehicle because currencies can not be traded by themselves. Instead, currencies are always prices in terms of a counter currency, so you will always need to remember to view forex pairs in this context.
Base Currency / Counter Currency
In forex, every time you time to trade the market you will see a quote that includes two currencies. For example, the EUR/USD poses the relatively value of the Euro against the value of the US Dollar. You will never see a tradable instrument that shows the EUR or USD by itself.
The first currency in any forex pair is referred to as the base currency. The second currency in the forex pair is known as the counter currency. A forex quote can almost be thought of as a fraction, because the value of the base currency is always equal to one. The value of the counter currency is the amount needed to buy 1 unit of the base currency. So, if the EUR/USD is trading at 1.5000, it means you will need to spend $1.50 US in order to purchase one Euro.
Relative Strength
Valuations in the stock market are much more straightforward. If Apple, Inc. (AAPL) stock is trading at $500, it means you can buy one share in the company for $500. You will never see a quoted price that pits Apple against Google (AAPL/GOOG). But when we trade currencies, you are always exchanging one currency for another — so you will need to know the value of both currencies in relation to one another.
Let’s take a look at how the EUR/USD is plotted on a chart:
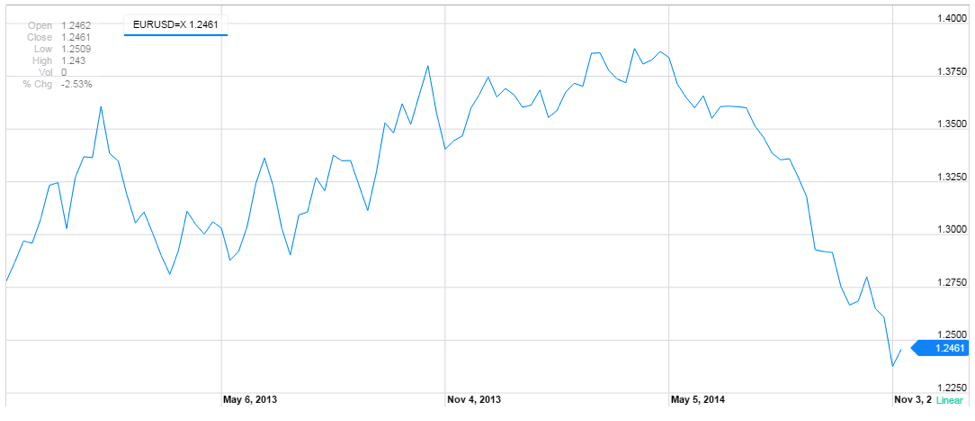
Chart Source: Google Finance
What does the above chart tell us? First, we can see prices steadily rising, and then later they start to fall. But since we are looking the relative value of two different currencies, how should this information be interpreted?
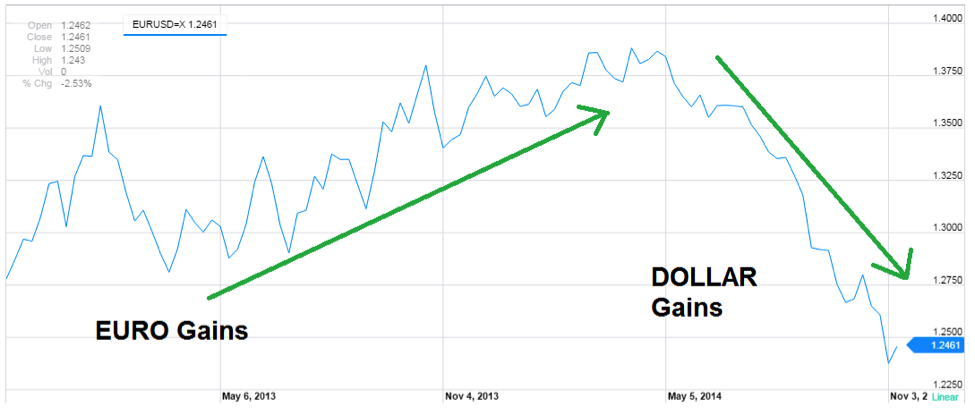
Chart Source: Google Finance
Remember, the first currency in any forex pair is called the base currency. This essentially means that it is the “basis” for the number quote that is associated with the pair. So when prices are rising on the chart, it means that the first currency (in this case, the EUR) is gaining. When prices on the chart are dropping, it means that the counter currency is gaining. In the real-time example above, we can see the EUR gaining strength in the first half of the charted history. Slightly after the mid-point, the USD starts to take over and this sends the quoted price in the EUR/USD lower.
Bid Price / Ask Price
The final factors to consider are the bid price and the ask price. There are always two parts to every forex quote, and there are always two parts to the price quote that is offered by your forex broker. Brokers try to make this easy, by giving traders two different prices that are clearly visible and labeled “bid” and “ask.” In other cases, they are labeled “buy” and “sell.” Let’s take a look at the graphic below:
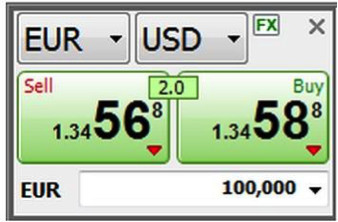
Here, we can see two different price values in the EUR/USD: 1.34568 and 1.34588. The first value is labeled here as the sell price. Other brokers will label this first value as the bid price. This might seem counterintuitive because “bidding” sounds like “buying.” But things are labeled this way because this is the price at which the broker is willing to sell access to that currency pair. If you were entering into the market with a short position, your entry price in this case would be 1.34568. The second value is labeled here as the buy price. Other brokers will label this first value as the ask price. If you were entering into the market with a long position, your entry price would be 1.34588.
It is critical to understand these differences because your overall profits and losses will depend on the difference between your entry price and your exit price. If you misunderstand the exact entry level where your trade is place, it makes it much more difficult to plan a broader strategy approach. Trade management is critical, and you will always need to know the price level at which your trade entries are placed.
Leverage And Margin
One of the most alluring aspects of the forex market is the ability to trade using leverage. Many brokers will offer potential leverage that is as high as 400:1 or 500:1, and this is something that can turn even the smallest trading accounts into massive market positions. There are some critical risks that should be considered here, however, as the promise of excessive gain can also lead to debilitating losses. Many expert traders point to over-leveraged accounts as one of the biggest mistakes that are made by new traders. Here we will look at some of the specifics involved when trading forex in leveraged positions.
Leverage Defined
So what exactly is trading on leverage? Specifically, trading on leverage means that you can put up a small amount of money to command a much larger position. For example, let’s say that you open a position using 100:1 leverage. In this case, you will only be required to have $1 in your trading account for every $100 in trading size. So, if you wanted to open a $100,000 position you would only need to have $1,000 in your trading account.
Prospects like this look highly attractive for those with small trading accounts. In a case like this, you could capture all of the available profits in a position that would be otherwise unaffordable. But nothing in life is free and every time you increase your potential for reward, you are also increasing your potential for risk. This is something that is lost on many new traders that are focused solely on possible profits and nothing else. But it is this type of mindset that quickly leads to significant losses and depleted trading account balances.
Margin Calls
Let’s again look at the example above and say that you have established a $100,000 position in the EUR/USD using 100:1 leverage. Here, your position size would be $100,000 and your trading margin would be $1,000. If the trade works in your favor, you keep all of the profits associated with that position size. But if the market works against you, things will start to get difficult if your account balance drops below $1,000 (which is the amount needed to keep the position open). If this occurs, a margin call will be executed and your trade will be immediately closed at a loss. This is a highly negative event because it can come at unexpected times and become very costly.
Maintaining A Protective Outlook
For these reasons, it is never a good idea to take out more leverage than your account can handle. Traders that become too greedy and focus only on profits will be unprepared if the market starts to work in the wrong direction. Leverage levels should never be maximized, and traders must always make sure that the account balance can withstand adverse moves without triggering a margin call. Stop losses and proper trade management are critical here, as you should always have an exact understanding on the amount of risk that is in place for any trade.
As a general rule, the total losses for any one trade should never exceed 2-3% of your entire account balance. This includes the maximized profits and losses that are generated through the use of leverage. So instead of trying to “beat the market” and get rich overnight, it is much better to take a slow and protective approach that will allow you to grow your account balance over time. Without this, it is much more likely you will lose your entire trading account much more quickly than you had expected. The greater the opportunity, the greater the risk. And if your account cannot withstand that risk, you will need to change your approach. This does not mean that leverage should be avoided altogether, but it does mean that leverage levels above 5:1 or 10:1 should be approached with extreme caution.
Technical Analysis In Forex Trading
As computer trading becomes more and more prevalent in the financial markets, we continue to see significant surges in popularity with respect to technical analysis strategies. Specifically, technical analysis refers to methods for evaluating historical chart activity that are used to forecast potential price movements in the future. The central idea here is that “history repeats itself” and that markets tend to work in identifiable trends. These trends can be then used to define a positive or negative outlook for forex prices and give traders an idea of whether a specific currency should be bought (in long positions) or sold (in short positions).
Those new to these ideas are usually struck with some degree of skepticism. How could it be possible that forex traders could simply look at a price chart and know where markets are headed in the future? But questions like these largely miss the point. Technical analysis does not tell us definitively where markets are headed. Instead, technical analysis gives us an idea of where markets are likely to travel in the future. Think of it in terms of probabilities rather than as a “crystal ball prediction.”
Benefits of Chart Strategies
Technical analysis differs from fundamental analysis in that the latter focuses instead on the underlying economic factors that could determine the outlook for a forex pair. But fundamental analysis can sometimes be very vague in nature and make it difficult for forex traders to define clear cut positions in an active trade.
This is where technical analysis methods really start to shine. Since these approaches look for areas where buyers and sellers have entered the market in the past, these types of strategies can really remove a lot of the guesswork that generally accompanies the establishment of new forex positions. Technical analysis might sound overly complicated to the uninitiated. But the fact is that chartist methods require much less data than fundamental analysis, and this can be highly valuable — especially in cases where traders are using short term time frames as the basis of their approach.
Stops, Entries, and Profit Targets
Many will argue that the main problem with fundamental analysis is that it is too difficult to choose exact price levels to enter and exit the market. However, any well-structured forex trade must include specific entry levels, stop loss levels, and profit target levels. Without this, you are opening yourself up to the whims of the market and a much greater potential for unnecessary losses. For these reasons, technical analysts are generally considered to have the “edge” over their fundamentalist counterparts once specific price levels need to be identified.
Trading Tools
So how exactly is technical analysis conducted? This is an important question but there are far too many approaches to be discussed in any one instance. To get a broad outline, some terminology should be introduced. Trends help traders identify the broad direction of the market, and a better sense of where the majority is positioning. Chart Patterns give traders an idea of when trends are changing and the extent to which a given price move is likely to continue. Indicators and Oscillators run forex price activity through complicated mathematical formulas and can produce signals that show when a specific asset has become overbought or oversold.
All of these trading tools will be discussed further in later articles. At this stage, it is mostly important to get a sense of the ways technical analysts view the market, the benefits that can be found using these strategies, and an introduction to some of the critical terminology that you will likely come across down the line. In short, technical analysts use past price chart activity to draw conclusions about what might happen in the future. This approach can be used in isolation, or in combination with fundamental analysis in order to define positioning bias in the forex market.
The Major Pairs
In most asset classes, there are generally a few major assets that traders tend to give the most attention. In commodities, this might be oil and the precious metals. In stocks, this might be blue chip names like Microsoft and General Electric or in benchmark indices like the FTSE 100 and the S&P 500.
In forex markets, the same rule holds true, and most of the trader attention is focused on the four major currency pairs: EUR/USD, USD/JPY, GBP/USD, and USD/CHF. You might be noticing a common theme here, as each of these pairs relates to the US Dollar in some fashion. This is because the greenback is considered to be the world’s reserve currency and it is the most liquid asset that can be found in the forex markets. Here, we will dissect these commonly traded currency pairs and discuss some of the terminology that is used when traders use these assets to establish positions in the forex market.
EUR/USD
The EUR/USD is the forex market’s way of quoting the value of the Euro against the value of the US Dollar. If the EUR/USD is trading at 1.3500, it shows that the one Euro is currently equal to $1.35 US Dollars. In terms of trading jargon, trading activity in the EUR/USD is also referred to as “trading the Euro.” Of course, there are plenty of other forex pairs that include the EUR but those looking to express a trading bias in the Euro most typically do so using the EUR/USD.
Those trading in the EUR/USD will generally remain cognizant of economic forces that most directly impact the Eurozone and the United States. This also means watching the interest rate differentials that have been established by the European Central Bank and the US Federal Reserve. The EUR/USD tends to trade in ways that are highly correlated with the GBP/USD, as both pairs are denominated in US Dollars and the UK economy shares a close relationship with the trends seen in the Eurozone.
USD/JPY
The USD/JPY is the second most commonly trade pair in the forex markets (behind only the EUR/USD). The USD/JPY shows the value of the US Dollar against the value of the Japanese Yen. If the USD/JPY is trading at 105.50, it shows that the one US Dollar is currently equal to 105.5 Japanese Yen. Trading activity in the USD/JPY is also referred to as “trading the Dollar-Yen.”
Those trading in the USD/JPY need to remain aware of any changes in Japanese economic trends, as well as any public policy statements that are released by the country’s central bank, the Bank of Japan (BoJ). Historically, the Japanese Yen has been associated with very low interest rates, and this makes forex pairs like the USD/JPY good vehicles to enter into “carry trading” strategies (which will be discussed in-depth in a later article). Price changes in the USD/JPY tend to show high correlations with the USD/CHF, as both forex pairs establish the US Dollar as its base currency.
GBP/USD
The GBP/USD shows the value of the British Pound against the value of the US Dollar. If the GBP/USD is trading at 1.70, it shows that the one British Pound is currently equal to $1.70 US Dollars. Trading activity in the GBP/USD is also referred to as “trading the Pound-Sterling” or “trading the Cable.”
Those trading in the GBP/USD need to remain aware of any changes in UK economic trends, as well as any public policy statements that are released by the country’s central bank, the Bank of England (BoE). Historically, valuations in the British Pound are highly sensitive to changes in consumer inflation. Higher inflation generally means higher interest rates (bullish for the Pound), while lower inflation suggests lower interest rates in the future (bearish for the Pound). Price changes in the GBP/USD tend to show low correlations with the USD/CHF, as the GBP/USD forex pair establishes the British Pound as its base currency.
USD/CHF
The USD/CHF shows the value of the US Dollar against the value of the Swiss Franc. If the USD/CHF is trading at 1.10, it shows that the one US Dollar is currently equal to 1.1 Swiss Francs. Trading activity in the USD/CHF is also referred to as “trading the Swissy.”
Those trading in the USD/CHF will watch for developing economic trends in Switzerland, and public policy statements released by the country’s central bank, the Swiss National Bank (SNB). Historically, the Swiss Franc is associated with safe haven buying and selling, so the currency tends to rise during times of global economic uncertainty and then fall during periods of economic stability.
What Is Forex?
Over the last few years, the financial trading markets have seen some drastic changes. One of these changes has been the surge in popularity for those trading currencies. These trades are conducted through the foreign exchange market — or the forex. Currency traders are able to capitalize on fluctuations in market price when they buy one currency in exchange for another. As long as you are able to accurately anticipate which currency will show relative strength — and then buy that currency — significant profits can be made.
While forex trading might seem new and “gimmicky” to some, it is actually the largest and most commonly traded market in the world. Each day, more than $2 trillion flows through the foreign exchange market — and many of those transactions are conducted by speculators that are looking to profit from the potential changes in market valuation that are seen on an almost constant basis. To gain some relative perspective here, $2 trillion is roughly 10 times the total trading volume of all the world’s stock exchanges combined. So any suggestion that the “new-fangled” forex market is somehow illegitimate would be misleading. Everyone from small retail traders to large investment banks tend to have at least some exposure in these markets, so it is critical for traders to have some sense of how these areas operate.
Impact of International Transactions
Of course, not all of these transactions are conducted by speculators. Many are regular business transactions that are conducted by overseas businesses. For example, if a car dealership in the UK wants to purchase a German BMW for its lot, the UK car dealer will need to convert British Pounds (GBP) to Euros (EUR) in order to complete the transaction. In its own small way, a transaction like this would increase the value of the EUR and decrease the value of the GBP because it would suggest changes in the supply/demand dynamics of both currencies. These types of transactions happen every day and can influence the relative value of individual assets in the forex market.
Forex Trading: What’s at Stake?
When forex traders are able to accurately anticipate which currencies are likely to rise (and which are likely to fall), significant investment profits can be captured. There is a wide variety of potential strategies that can be used to make these forecasts in the forex market, and these will be covered in-depth in later articles. At this stage, it is most important to remember that any forex trade will involve the simultaneous buying and selling of two different currencies. Here you will literally be exchanging one currency for another. If you can successfully forecast which of these two currencies will be weaker and which will be stronger, profits will be realized. If not, there is the potential for losses in your trading account.
This is another critical point to remember: Forex trading does come with its own level of risk. For these reasons, it is generally advisable for forex traders to begin with a demo account that will allow you to trade the market under live conditions using virtual money. This will help you to avoid the impact of many rookie mistakes that have left many traders penniless before they even get started. Forex trading needs to be approached as a strategized discipline, rather than as a gambling slot machine. This is the only way to ensure sustainable success over the long run.
Benefits of Liquidity
For investors that are thinking of getting started in forex trading, there are some unique benefits that should be considered. As the most liquid trading market in the world, traders are easily able to navigate through potential positions 24 hours a day, seven days a week. This is not something that can be said for some of the more traditional investment methods (for example, stocks or mutual funds). When trading forex, it is much easier for investors to move in and out of positions without many of the liquidity concerns that inhibit many traditional stock trades. For those with a more active mindset, this presents critical advantages as there will never be difficulties or delays when looking to capitalize on an emerging market move.
Commodity Currencies
In forex markets, most currencies tend to be associated with specific events or asset classes. For example, the Swiss Franc is typically thought of as a “safe haven currency,” which is bought during times of widespread economic uncertainty and sold-off when the global environment stabilizes. Other currencies are more closely tied to specific assets. Three currencies that fall into this category are known as the commodity currencies.
In terms of forex symbols, these include the Australian Dollar (AUD), the New Zealand Dollar (NZD), and the Canadian Dollar (CAD). Here, we will look at the forex pairs that are most commonly used to express positions in the commodity currencies and discuss the ways that price forecasts can be made when drawing comparing these pairs to movements seen in energy and metals commodities.
AUD/USD
The AUD/USD is the forex market’s way of quoting the value of the Australian Dollar against the value of the US Dollar. If the AUD/USD is trading at 0.9000, it shows that the one Australian Dollar is currently equal to 90 cents US. Trading activity in the AUD/USD is also referred to as “trading the Aussie.” Those trading in the AUD/USD will often look to price trends in metals markets as a way of forecasting where forex valuations might move next.
For example, major sections of the Australian economy are centered in mining for copper and precious metals — generally for later sale to emerging Asian markets. So if we start to see strong bullish moves in copper, there will be many forex traders looking to buy the AUD/USD in anticipation of later moves higher. Many other factors are involved when attempting to place an appropriate valuation on the Australian currency and it is always a good idea to have some sense of the current policy stance at the Reserve Bank of Australia (RBA). But since the fate of the AUD/USD is so closely tied to metals prices, it is also considered to be a commodity currency.
NZD/USD
The NZD/USD shows the value of the New Zealand Dollar against the value of the US Dollar. If the NZD/USD is trading at 0.7500, it shows that the one New Zealand Dollar is currently equal to 75 cents US. Trading activity in the AUD/USD is also referred to as “trading the Kiwi.”
From an economic standpoint, the New Zealand economy is heavily agricultural and sensitive to changes seen in global commodities prices. Price moves in the NZD are also highly correlated to valuation changes seen in the AUD/USD because the Australian and New Zealand economies are significantly interconnected. Additional factors to consider when trading the Kiwi include any stated policy changes at the Reserve Bank of New Zealand (RBNZ). The NZD is typically associated with high interest rates and will often benefit when a majority of market traders are looking to establish carry trades.
USD/CAD
The USD/CAD shows the value of the US Dollar against the value of the Canadian Dollar. If the AUD/USD is trading at 1.2500, it shows that the one US Dollar is currently equal to 1.25 Canadian Dollars. Trading activity in the USD/CAD is also referred to as “trading the Loonie.” Those trading in the USD/CAD will often look to price trends in oil markets as a way of forecasting where forex valuations might move next.
Canada has the world’s second largest supply of known oil reserves (behind only Saudi Arabia), so the value of the country’s currency is closely correlated to the underlying price of oil. For example, any bullish movements in oil prices will also lend a supportive tailwind to the value of the Canadian Dollar. In the USD/CAD, this would mean a lower quoted rate because the Canadian Dollar is the counter currency in this forex pair (a higher CAD means a lower USD/CAD). Any bearish movements seen in oil prices tends to create a bearish effect in the Canadian Dollar, which means upward moves in the USD/CAD. Those trading this currency pair should also have a firm understanding of the current policy stance at the Bank of Canada (BoC).
How To Calculate Profits And Losses
When you get started in forex trading, it might be very tempting to jump right in and start establishing new positions. After all, you can make any money if you are not committed in the market, right? Unfortunately, this is the type of mindset that can quickly lead to excessive losses and depleted account balances. So, you will always need to take a tempered approach and possess a conservative outlook when you are committing real money to the forex market.
Proper Trade Structuring
The first step before placing any forex trade is to properly structure your position. This means having a crystal clear idea of where you will place your trade entry, where you will exit the market if things work in the wrong direction, and where you will take your profits if the next trends work out favorably.
In order to determine the position sizes that are appropriate for your trading account, you will need to know how to calculate profits and losses in each position. Most computer trading platforms will calculate your profits and losses automatically once the position is open. But if you do not do this manually before the trade is placed, you will not be able to set your profit targets and stop losses in the right areas.
Profit Trading Example
To gain a better understanding in these areas, we will consider two trading examples — one where profits are realized and another trade that results in a loss. Let’s assume that the Bid/Ask in the EUR/USD is currently 1.3610/13. This would mean that you could buy one Euro for $1.3613 and sell one Euro for $1.3610. Assume that you have a bullish stance on the EUR/USD currency pair and you buy the pair at 1.3613.
Your position size is 100,000 Euros, which are bought for 136,130 US Dollars. If you execute this trade using 10:1 leverage (10% margin), your initial cash outlay (margin deposit) is $13,613.
Let’s assume that the market works in your favor, and valuations in the EUR/USD rises to 1.3643/46. You decide to capture your gains and close out the trade. Current prices show that you can sell your Euros at a market price of 1.3643. In terms of pip values, you have captured 30 pips. How does this work out to real money values?
Initially, you bought 100,000 Euros for 136,130 US Dollars. Then, you sold those 100,000 Euros for a total of 136,430. The difference here is $300 (136,430-136,130). Immediately, you will see your total account balance rise by $300.
Loss Trading Example
Next, we will look at how a losing trade would unfold. Assume that we still buy in at 1.3613. The position size is 100,000 Euros, which are bought for 136,130 US Dollars. The trade is executed using 10:1 leverage (10% margin), your initial cash outlay (margin deposit) is $13,613.
Now we will assume that the bullish trade works out unfavorably, and market prices fall to 1.3603/06. We decide to cut the losses on the assumption that our initial trading bias was incorrect. In order to close the position, you must “sell back” the Euros you initially purchased. This is done at the market price of 1.3603, with a total value of 136,030 US Dollars. This is less than the initial value, so our account will immediately be debited at a loss of -$100 (136,030-136,130).
Establishing Risk
These types of calculations are important, and will allow you to establish your total risk level before you enter into any specific trade. Some traders will look at potential losses in terms of the amount of money that is being put at risk at any given time. Other traders will set risk as a percentage of account size (2-3% is a good general rule). In any case, do not make the mistake of executing a position without first knowing your maximum potential losses, as this will prevent unfavorable surprises down the line.