
Options Advanced
Expanding Your Options Strategies
Now that you have reached the advanced stages of your options trading education, it is time to start expanding your trading strategies so that you can truly take advantage of the opportunities these markets have to offer. When we compare options trading to other traditional forms of investment, it is undeniable that there are many additional strategy choices that are made available to traders. The complexity of these added choices might appear daunting for those with little trading experience. But once we take apart these strategies and analyze the basic of the positioning, things start to become easier to understand.
For the most part, options trading involves the establishment of one of two stances: bullishness and bearishness. Bullish positions are established when you believe the price of an asset is going to rise. Bearish positions are established when you believe the price of an asset is going to fall. This is true for all asset classes, whether you are trading, stocks commodities, indices, or currencies. But when we are dealing with options, it becomes much easier to use multiple positions to express a market view.
In fact, many options strategies will allow you to use both bullish and bearish trades in conjunction with one another. This might seem counter-intuitive — and it might even seem as though it would be impossible to make any money in the financial markets if you are taking a bullish and bearish trade in one asset at the same time. But when we look at many of the expanded strategies that are on offer for those interested in trading options, we can see that this is just not the case. Here, we will look at a summary some of the advanced options trading strategies which will be covered in greater depth later in this section.
Advanced Options Positioning
By now, you are probably familiar with the call and put options that make up most of the basic options strategies. But when we use these basic strategies in conjunction with one another, more complicated techniques can be implemented. It can be argued that the options market offers more choices for traders than any other type of investment in the financial markets. And this allows traders to express a market view in a wide range of varying degrees. Those trading with traditional investment techniques tend to be limited by basic buy and sell positions. Options traders have many more tools at their disposable — and positions can be based on the degree to which an investor expects asset prices to rise or fall in the future. Are you slightly bullish on the S&P 500 over the next month — but not excessively so? Do you believe that oil prices are likely to plummet over the next quarter?
Options trading offers strategies for all of these outlooks on the market, and here we will outline some of the basic option types that are associated with each stance that can be taken on an asset.
Bullish Option Types
When you believe the price of an asset will rise in the future, you will need to find ways to establish a bullish stance in the market. Traditional investors might look for ways to buy a stock or commodity, for example. But when we are dealing with advanced options strategies, there are many more choices available — and each of these choices can be structured to cater to the degree to which you expect the asset to perform strongly in the future. Do you expect a strong rise in the asset price over your chosen time frame? Or do you merely expect a moderate drift higher before your options contract is scheduled to expire? Luckily, there are options strategies available that can be tailored to fit each of these outlooks.
For those with the most bullish outlook on an asset, the Long Call option is generally considered to be the best choice. With this strategy, investors are able to collect all of the gains that are accumulated during the contract period, but there is also a good deal of benefit to be found in the Call Backspread. For those with a moderately bullish outlook, the Bull Call spread or Collar strategies become more appropriate. Other bullish choices include the Bull Calendar spread, Covered Calls, Naked Puts, and the Covered Straddle.
Bearish Option Types
For those expecting the price of an asset to fall, bearish options strategies becomes appropriate. If you are expecting the asset price to fall drastically, the best choices to express that view would include the Long Put and Put Backspread strategies. These are the techniques that give options traders the most market exposure to downside moves in asset prices. But if you expect the price of your asset to see only modest declines, strategies like the Bear Put spread and Covered Put technique can be used. Naked Calls would also fall into this category but this strategy is generally considered to be too risky for options traders with a conservative outlook and tolerance for risk.
Neutral Option Types
If there is nothing significant happening in the market and you believe asset prices will trade sideways during your contract period, neutral options strategies are most appropriate. Since a neutral outlook essentially implies that there is reduced volatility in the market, there is less of a degree difference when implementing these techniques. Those with a neutral outlook for an asset should consider using Ratio spreads, Straddles, Strangles, Butterflies, and Condors as chosen methods.
Most of these techniques will be explained in greater detail later in this tutorial. At this stage it is a good idea to become familiar with these terms so that you will be able to understand the outlook an options traders is attempting to express when employing these techniques as well as the way it relates to the likely price direction of the asset being traded.
Combining Fundamental and Technical Outlooks
No matter which options trading strategy you prefer, you will first need ways of assessing a broader stance on the market. For example, having a solid Iron Condor strategy will you you little good if you have no forecast for how the underlying asset will likely perform in the future. Of course, there are two general approaches that are used by options traders in determining a market outlook for a given asset: technical analysis and fundamental analysis.
Many expert options traders will say they tend to base most of their decisions on one form of analysis or the other. But there is absolutely nothing wrong with applying both methods to your trading — and many expert traders will argue that no real-money position should be taken in the market unless you have both a technical outlook and a fundamental outlook that agree with one another. If this is not the case, those traders would argue that there is not enough of a probability of success in your trade to justify a position. For these reasons, it makes sense for traders to have some understanding of how market participants might pair a fundamental outlook with a technical chart outlook. Here, we will look at some examples of how this might be accomplished.
Searching for Agreement
The first step in the process is to look for market forecasts that agree with one another. Having a strongly bullish technical analysis outlook on a stock that appears weak from a fundamental perspective will be of little use — and likely result in a losing trade. It is essential for options traders to pair positive technical/fundamental outlooks with bullish positions and negative technical/fundamental outlooks with bearish positions. This is the only way it becomes possible to turn the odds in your favor and generate profitable trades on a consistent basis. If you have a better than 50/50 outlook from both the technical and fundamental perspectives, it is much more likely you will not experience a series of losing trades that will incapacitate your trading account.
Trading Example
Next, we will look at a hypothetical example that shows agreement from the two commonly used analysis methods. Anyone that is familiar with commodities markets knows that gold prices tend to rise during periods of global economic uncertainty. Those trading options tend to use these factors as a basis for positioning in the market, and there are several examples in recent history that have displayed this type of environment.
One of the most memorable examples could be found in the credit crisis of 2008. Then, many long-established international organizations were filing for bankruptcy and investors were looking for other areas of the market to place their money. Options traders know that money flowing out of the stock market will need to be used to purchase other assets — and one of the most common vehicles during these times is gold and silver. So, from a fundamental perspective, the added global uncertainty seen in 2008 would be expected to generate rising prices in gold and the other precious metals.
This activity can be seen in the historical gold chart below:
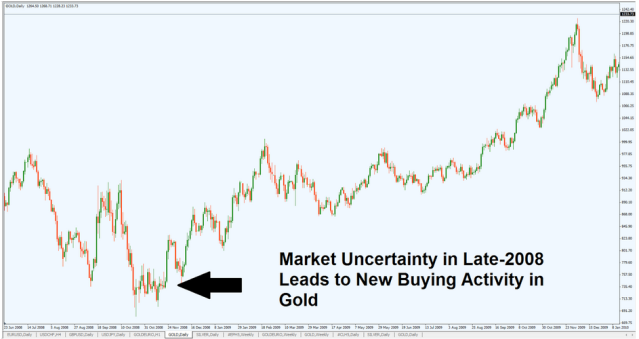
Chart Source: Metatrader
In this chart, we can see that once global economic uncertainty reached its peak, market prices in gold hit a trough. This inspired a bullish outlook for most of the participants in the market — and the buying activity that followed created a new uptrend in the precious metals space.
For options traders, this meant widespread initiations of new call positions in gold. But is this the only form of analysis that could have been used to initiate positions? Technical analysis traders would almost certainly answer this question with a resounding “no.” This is because those traders would want additional confirmation to become visible in the gold price charts themselves. Let’s consider the same price history in gold and add a critical resistance level that would have been visible using most technical analysis strategies:
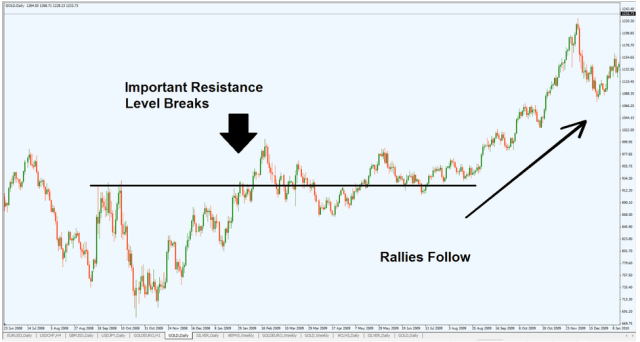
Chart Source: Metatrader
In this chart example, we can see that prices begin to rise above the resistance level that preceded the spike lows in October 2008. Technical traders looking for reversal opportunities would have kept a close eye on gold’s ability to break above this resistance zone, as this would have suggested that the declines were ending and that a new bullish trend is in place.
Improving Probabilities
Either of these signals might be enough for new traders to establish bullish positions in gold. On the fundamental side, rising global uncertainty would suggest that investors would choose to start moving into gold as a means for gaining safe haven protection from vulnerable market alternatives. On the technical side, sharp price reversals and breaks of important resistance zones suggest that market momentum has shifted and that a new bullish trend is building in force.
But for options traders with a conservative outlook, it is important to understand that the combination of both these events creates improved probabilities for profitable trades. Scenarios where both the fundamental and technical outlook are in agreement are the scenarios that should be viewed as most preferable for those looking to place active trades in the options market. In this case, the underlying asset was gold and the dominant outlook was bullish. But these same rules apply to all asset classes and for all market directions. Keeping these elements in mind at all times can be helpful in reducing the potential for losses in your options trading account.
News Trading
In the previous section, we discussed the importance for advanced options traders to consider using both technical and fundamental analysis when establishing a market view. In some sense, technical analysts have it easy: these strategies use technical indicators and price histories to determine where the dominant market trend is headed next. Fundamental analysts do not have it quite as easy because there are so many areas to watch when forming an opinion for what is likely to happen to asset prices in the future. For these reasons, it is a good idea to have at least a basic understanding of the ways news events can influence the options market.
For the most part, economic events that impact the financial markets are scheduled well in advance. These events can take a few different forms, but there are some basic categories that can be used for trading different types of assets. Here, we will look at some of the most important news events, The asset classes that are most heavily impacted by those events, and the ways options traders will use those events to establish positions in the market.
Earnings Season
For those focused on stock markets, the earnings season tends to bring in most of the market-moving news events that can be used for establishing positions. Each quarter, publicly traded companies are required to report on their performance during the previous three months. This information can be highly valuable for investors because it offers great insights into the financial health of the company and its likely ability to generate revenue doing forward. There is always an expectation for the revenue number that a company will release in its public earnings report.
When the final results come in better than the market expectation, stock prices tend to rise. When the final results come in weaker than the market expectation, stock prices tend to fall. Consider the following price chart in Google, Inc. (GOOG):
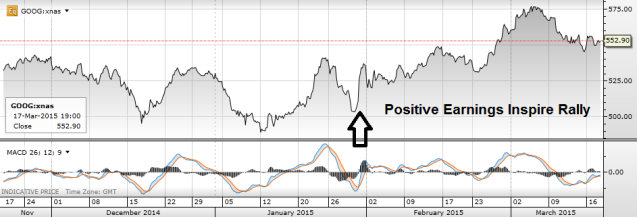
Chart Source: Metatrader
In the chart above, we can see that GOOG stock was experiencing short-term declines right before the release of a major quarterly earning report. Market expectations were calling for weakening revenues for the quarter, but there was a significant upside surprise that led to a round of buying activity in the stock. Since a weak report was expected and a strong report was the actual result, many options traders used the opportunity as a new chance to start entering into call options for the stock, and this help propel a rally in the days and weeks that followed.
When watching for earnings figures, most of the market is focused on the earnings-per-share (EPS). This is the amount of earnings the company was able to generate during the previous quarter, divided by the number of outstanding shares in the stock. Positive surprises tend to fuel price rallies whereas disappointing results tend to lead options traders to start buying puts.
Economic Data Releases
The next types of news release that is important for options traders is the economic data release. These figures typically describe market activity on the national level, and this would include reports like Gross Domestic Product (GDP), retail sales, consumer inflation, manufacturing productivity, and the unemployment rate. Since these are largely unrelated to the performance outlook for specific stocks, options traders will need to look to apply this news information to different asset classes. Most relevant here would be stock indices and currencies, as these are the broadest measure of economic activity. Both of these asset types tend to experience significant price movements when important economic data releases make it into the news headlines. Consider the following price chart in the EUR/USD:
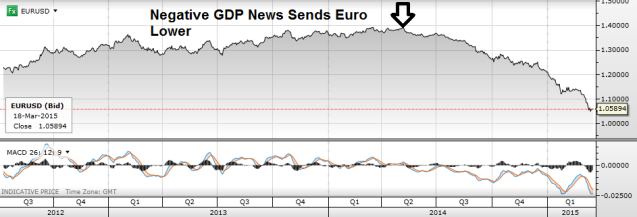
Chart Source: Metatrader
In the chart above, we can see price activity in the EUR/USD after a major economic report was released. Yearly GDP for the Eurozone was expected to show strengthen and come in at higher levels when compared to the previous year. The results, however, surprised the market and the yearly GDP actually came in lower than what was seen the year prior. The inspired options traders to enter into options contract that offered Euro Put / US Dollar Call exposure, as there was greater anticipation that the weakening GDP data out of the Eurozone would send the Euro lower in the future.
Central Bank Meetings
Last, we look at the impact of central bank meetings. These meetings can be important on a number of different levels, as they will generally dictate monetary policy for a country for an extended period of time. Key names to watch here include bodies like the US Federal Reserve, the European Central Bank, the Bank of England, the Bank of Japan, the Swiss National Bank, the People’s Bank of China, and the Bank of Australia. Whenever any of these bodies elect to increase or decrease interest rates, the major stock benchmarks in the country will likely experience increased trading volume and market volatility. increasing interest rates tend to have a bearish effect on stock markets. Decreasing interest rates tend to have a bullish effect on interest rates.
But central bank meeting can also have a major influence on commodities markets. Consider the following price chart in gold:
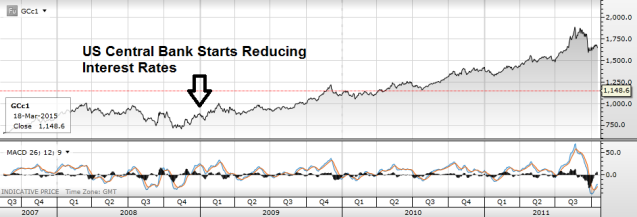
Chart Source: Metatrader
Rising interest rates tend to have a bearish impact on gold and precious metals. Falling interest rates tend to be bullish for the space. In the price chart above, we can see an instance where the US Federal Reserve began to cut interest rates in efforts to propel activity in the broader economy. Once these decisions were made, most options traders began buying call options in gold because lower interest rate environments tend to be supportive for precious metals.
Advanced Technical Indicators
News releases are critically important in determining where short-term price volatility is headed for a given asset. But when we are looking for specific price levels to use as the basis for real-time options trades, there are significant advantages for those willing to employ technical analysis methods in trade construction. Here, key terms like support and resistance, trend, and momentum can be highly valuable in determine a technical analysis stance.
But once you reach the advanced stages of your options education, you will be able to improve your chances for profitability in each trade if you add technical indicators to the mix. These indicators will allow you to confirm which trades are most likely to match your outlook and end in profitability. In this section, we will look at some of the most commonly used tools for those looking to employ advanced technical analysis strategies.
Relative Strength Index
One of the most popular technical indicators used by options traders is the Relative Strength Index, or RSI. This indicator is effective in helping traders spot instances where the price of an asset has diverged significantly from its historical averages. The RSI shows readings that range from 0 to 100. Readings below 30 suggest that the asset has become oversold and is likely to start moving higher in the future. This would create a climate that is suitable for establishing call options. Readings above 70 suggest that the asset has become overbought and is likely to start moving lower in the future. This would create a climate that is suitable for establishing put options.
Consider the chart below showing a price history in the S&P 500:
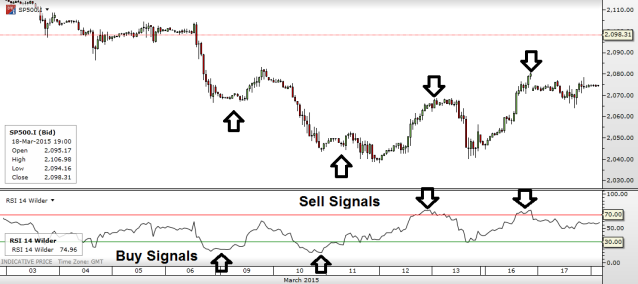
Chart Source: Metatrader
In the chart above, we can see how the RSI sends buy and sell signals on the price chart. The red line marks the oversold indicator zone. And when the indicator reading falls into this area it is a signal for options traders to establish call options as it is essentially a suggestion that prices will start to rise back toward the historical averages. The green line marks the overbought indicator zone. When the indicator reading falls into this area it is a signal for options traders to establish put options as it is essentially a suggestion that prices will start to fall back toward the historical averages. These signals are outlines using arrows in the chart above.
Commodity Channel Index
For commodities traders, one of the most popular technical indicators is the Commodity Channel Index, or CCI. The indicator can, in fact, be used for any asset class but it was designed specifically with commodity trends in mind. There are some similarities in the way that the CCI relates to the RSI. But the calculations involved are different, and the range for the indicator reading itself is plotted along a different scale.
Specifically, the CCI uses a scale that ranges from -100 to +100. Readings that fall below the -100 mark indicate that asset prices have become oversold. This would create a climate that is suitable for establishing call options. Readings above +100 suggest that the asset has become overbought and is likely to start moving lower in the future. This would create a climate that is suitable for establishing put options.
Consider the following chart in oil:
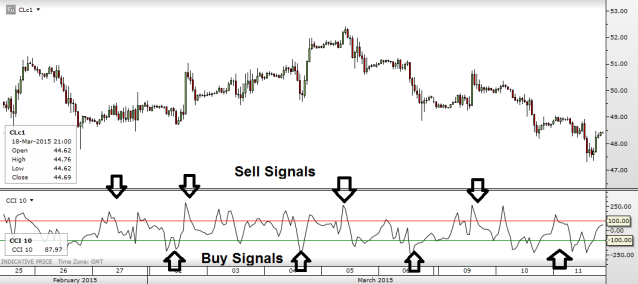
Chart Source: Metatrader
In the chart above, we can see how the CCI sends buy and sell signals on the price chart, and there should be some noticeable similarities with the RSI. But the exact numerical readings differ. The red line marks the oversold indicator zone. When the indicator reading falls into this area it is a signal for options traders to establish call options as it suggests that prices will start to rise back toward the historical averages. The green line marks the overbought indicator zone. When the indicator reading falls into this area it is a signal for options traders to establish put options as it suggests that prices will start to fall back toward the historical averages.
Stochastics
For those trading in currency options, one of the most popular technical tools is the Stochastics indicator. When we compare the Stochastics indicator to some of the other technical tools included in this tutorial. The indicator reading itself oscillates between overbought and oversold readings in ways that are similar to both the RSI and the CCI. But when we look at a visual example of the Stochastics indicator, some key differences will immediately become apparent.
Consider the following chart in the GBP/USD:
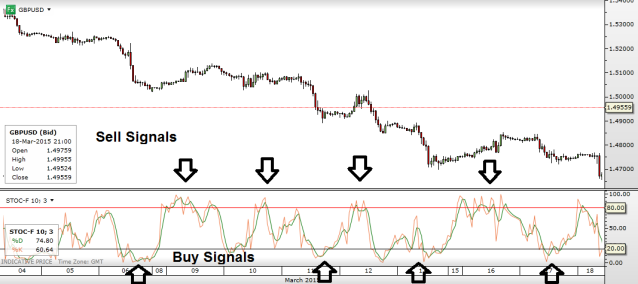
Chart Source: Metatrader
The Stochastics indicator includes a red and green line that marks the oversold and overbought areas. These lines follow the same rules as the RSI indicator. The indicator range scales from 0 to 100 and readings below 30 suggest that asset prices have become oversold. Readings above 70 suggest that the asset is overbought. But where there are differences is in the indicator line itself. Both the RSI and CCI show indicator lines that are comprised of one line but the Stochastic indicator line is made up of two lines. These are the fast Stochastic line and the slow Stochastic line. This added line gives options traders additional information as it helps plot the next emerging trend in the indicator reading. When the fast Stochastic line crosses above the slow Stochastic line, a bullish signal is sent and the indicator is likely to start rising. This creates an environment where call options are appropriate. When the fast Stochastic line crosses below the slow Stochastic line, a bearish signal is sent and the indicator is likely to start falling. This creates an environment where put options are appropriate.
Fibonacci Retracements
Now that we have an understanding of the advanced technical indicators used by options traders, it is a good idea to start looking at some of the methods expert technical analysis traders use to view support and resistance levels.
It can be argued that the terms support and resistance are the most important ideas in the realm of charting techniques. We have covered these terms in a more in-depth way in a previous section. But we can summarize the importance of those terms by saying that support levels mark areas where a majority of market participants have bought an asset in the past. Resistance levels mark areas where a majority of the market has sold an asset in the past. Support levels are typically used by options traders as a basis for establishing call option positions, while resistance levels are typically used by options traders as a basis for establishing out option positions.
Fibonacci Retracements
But there are other methods that can be used to determine these levels, as well. One of the most popular choices amongst technical analysis traders is the Fibonacci retracement, which is a more objective way of determining where buyers and sellers are likely to start entering the market. Fibonacci retracements are based on the Fibonacci sequence, which is a series of numbers developed by a renowned 13th century mathematician. But in the modern trading environment, these numbers have taken on a vastly new meaning and traders using Fibonacci retracement techniques are often able to spot turning points in the price of an asset well before the majority of the market.
The first step in plotting Fibonacci retracements is to find a clearly defined market move that designates a trend in a specific direction. These movements can be either bearish or bullish. But the most important factor is that you select a move that is going to be visible.
Consider the following chart in the GBP/USD:
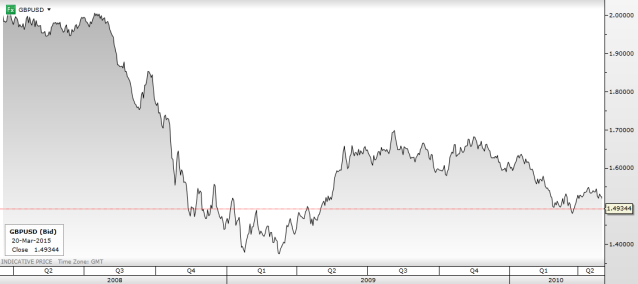
Chart Source: Metatrader
What is the dominant trend in those price history for the GBP/USD? Prices start to the left of the chart at the highs, and then close the chart period near the lows. Clearly, a downtrend is in place and it is relatively clear that the price levels defining this move go from 2.00 to below 1.40. The dominant move here is something that would be clear to most in the market, and this is the price move that Fibonacci traders would likely use to structure their analysis. In most cases, this would lead to Fibonacci analysis that looks something like the chart below:
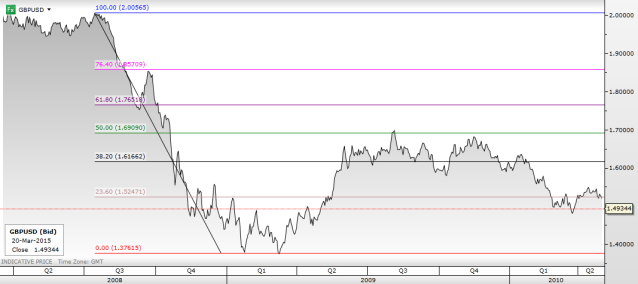
Chart Source: Metatrader
In the appropriate Fibonacci analysis, a line would be drawn from the highs in the chart, all the way down to the lows in the bearish move. In this example, this would mean that the critical Fibonacci move stems from around 2.00565 to 1.37615.
Important Price Levels
When we use modern trading software, all of the manual work involved deals with identifying the major trend move. We have already done this, so the next step in the process is to identify the major FIbonacci levels that relate to this move. In most cases, Fibonacci traders will pay attention to the 38.2%, 50%, and 61.8%. Some traders will add the 23.6% and 78.6% retracement to the analysis — but this is not as common.
What exactly do these numbers mean? Let’s say that a stock moves from $0 per share to $100. Clearly this would establish a bullish move. Then, let’s say that the stock falls to $50. This would mean that the stock had completed 50% of its initial bullish move. Each of these Fibonacci numbers is expected to act as support or resistance (depending on the direction of the original move). If the initial price move is positive, each Fibonacci level will be expected to act as support. If the initial price move is negative, each Fibonacci level will be expected to act as resistance.
Let’s again look at our original example in the GBP/USD:
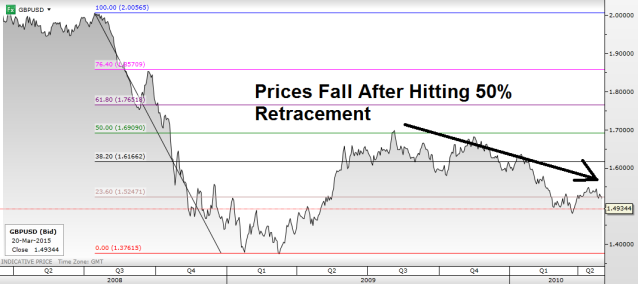
Chart Source: Metatrader
Since the original trend direction is downward, each FIbonacci level would be expected to act as a point of resistance. After hitting the trend lows, prices start to rise in a corrective upside move. But, it should be remembered that a “corrective” move in no way suggests that the major trend is completed itself. Instead, the asset is simply readying itself for the next move lower.
In the GBP/USD example, prices correct and rise just above the 1.70 level. This area marks the 50% retracement of the original move. Prices then start to fall, confirming the Fibonacci zone as a valid level of resistance. Options traders that see this activity in its earliest stages would then be able to establish put options in the GBP/USD. This position would have paid off handsomely, as we can see that prices then began to resume the dominant bearish trend and finished its activity much lower on the chart.
This is the type of approach that options traders take when basing positions off of FIbonacci analysis. This example is a bearish example but all of the same rules apply when the underlying trend is bullish. In those cases, the initial move would be travelling in the upward direction and then each of the Fibonacci retracement would be viewed to act as support levels. In those cases, call options would be more appropriate for those investing in the options markets.
Credit Spreads
Next, we turn to the fundamental perspective. When we look at advanced fundamentalist options trading strategies, one of the first techniques encountered is the credit spread. A credit spread is a derivative contract that allows options traders to transfer credit risk, through the sale and purchase of options. The option buyer pays a premium to the options seller and receives the potential for gains when the spread narrows or widens. Traders can use both calls and puts to implement credit spread strategies, and this ultimately means that credit positions can be both bullish (long) or bearish (short). Here, we will look at some example of how credit spreads work so that options traders can use these strategies to establish active positions in the market.
Bull Put Spreads
The first credit spread strategy we will discuss here is the Bull Put spread, which uses put options to establish a neutral to bullish stance on market assets. For example, let’s assume that you have a positive outlook on the FTSE 100 stock index, and that we expect the index to rise in value over the next month. Let’s assume that the FTSE is currently trading at 5750 and we expect that number to increase in the next 30 days. We would then sell a 1-month put option in the FTSE 100 with a strike price of 5800 and then buy another put option in the FTSE 100 with a strike price of 5700 at the same time.
There are some factors here that should be noted. First, it should be clear that we are selling a put option that is in-the-money (higher strike price). We would be receiving a net credit for this sale, and this is the reason the strategy qualifies as a “credit” spread. Second, we are buying a put option that is out-of-the-money (lower strike price). So, the Bull Put spread requires the simultaneous sale and purchases of two options using the same asset and the same expiration period. This structure can be visualized using the chart shown below:

Chart Source: Wikipedia
From this chart, we can see that the position achieves profitability if the asset price trades sideways or higher before the expiration period closes. If asset prices move above the higher strike price, each option will expire worthless and the position will achieve maximum profitability. Total earnings will equal the credit earned when initially entering into the position. Calculating this maximum profit is relatively simple, and can be done using the following steps:
- Maximum profits are realized when market prices rise above the strike price of the short put option
- Maximum profits are equal to the net premium collected from the sold put option, less the commissions paid for the purchased put option.
On the flip side, maximum losses are seen when asset prices fall below the lower strike price before the expiry period ends. These losses are equal to the difference between the lower and higher strike prices of the sold and purchased put options, less the initial credit that is collected when the position is established. The strategy hits its break even point (no gains or losses) when the strike price of the short put generates losses that are equal to the initial credit collected when the position is established.
In these ways, we can see that options trading with credit spreads will create scenarios where the potential for both gains and losses is limited. This is why credit spreads are generally best suited for options traders that are approaching the market with a conservative outlook.
Bear Call Spreads
The next type of credit spread we will cover here is the Bear Call spread. As the name suggests, the Bear Call spread is utilized when an investor has a neutral to negative outlook for an asset. The strategy involves the use of call options in a simultaneous purchase and sale of two different contracts.
Let’s return to our earlier example using the FTSE 100 but now assume that we have a bearish outlook for the stock index over the next month. Here, we are going to buy one out-of-the-money call option (with a higher strike price) and sell an in-of-the-money call option (with a lower strike price). The underlying asset is the same, and the expiration period is the same for both assets. Bear Call trades qualify as a credit spread because a credit is collected when the position is established. In our hypothetical example, we could establish this position by buying a 1-month FTSE 100 call option with a strike price of 5800 and then selling a 1-month call option with a strike price of 5700. This structure can be visualized using the chart shown below:
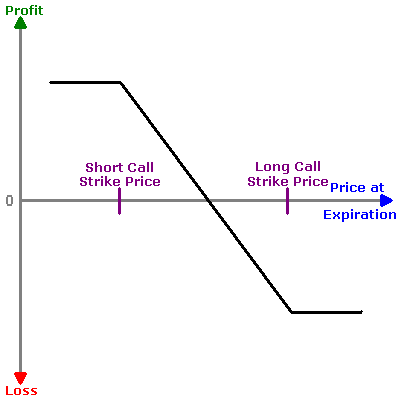
Chart Source: Wikipedia
To achieve maximum profitability in a Bear Call spread, asset prices must close the contract period below the strike of the sold call option (this is the lower strike price of the two options contracts). If this occurs, both options contracts will expire worthless and the investors will capture the credit that was generated when the position was opened. Calculating this maximum profit can be done using the following steps:
- Maximum profits are realized when market prices fall below the strike price of the short call option
- Maximum profits are equal to the net premium collected from the sold call option, less the commissions paid for the purchased call option.
Maximum losses for Bull Call spread are seen when asset prices rise above the higher strike price before the expiry period ends. These losses are equal to the difference between the lower and higher strike prices of the sold and purchased put options, less the initial credit that is collected when the position is established. The strategy hits its break even point when the strike price of the short call generates losses that are equal to the initial credit collected when the position is established.
Debit Spreads
In the previous section, we looked at credit spreads which is one of the first advanced techniques that are attempted by options traders. But there is another similar strategy that takes the opposing stance and allows options traders to profit in alternative ways. This strategy is called the debit spread, which gets its name from the fact that a net debit is created when the position is opened.
This debit comes from the fact that the premiums collected for the sold options are smaller than the premiums paid for the purchased options. But while it might seem like you are willingly entering a losing trade from the start, it should be remembered that this debit is the maximum loss that is possible for the trade. If you are correct in choosing the direction of the market, that debit will close with the potential to ultimately close in profitability.
Bull Call Spreads
The first debit spread strategy we will discuss is the Bull Call spread, which uses call options to establish a neutral to bullish stance on market assets. For example, let’s assume that you have a positive outlook on the oil prices, and that we expect the commodity to rise in value over the next month. Let’s assume that the price of oil is currently trading at $90 per barrel and we expect that number to increase in the next 30 days. To express this market view, we would buy one at-the-money call option (with a lower strike price) and at the same time sell another out-of-the-money call option (with a higher strike price) in the same asset and the same expiration time. So, as a hypothetical example, this could mean that we buy a 1-month call option in oil at $80 and then sell a 1-month call option in oil with a strike price of $100.
The structure of the Bull Call debit spread can be visualized using the chart shown below:
Chart Source: Wikipedia
From this chart, we can see that the position achieves profitability if the asset price trades sideways or higher before the expiration period closes. If asset prices move above the higher strike price, each option will start to cancel out the other in terms of gains and losses. The early gains made on the purchased call option (at the lower strike price) will erase the losses incurred with the initial debit. Calculating this maximum profit is relatively simple, and can be done using the following steps:
- Maximum profits are realized when market prices rise above the strike price of the short call option
- Maximum profits are equal to the different the strike prices of the sold and purchased call options, less the initial debit and commissions paid for the establishing the trade.
On the other side of the equation, maximum losses are seen when asset prices fall below the lower strike price before the expiry period ends. This would mean that both options would expire worthless, and the trade will not recover the debit that was initially accumulated in the trade. The strategy hits its break even point (no gains or losses) when the gains made in the purchased call options are equal to the initial debit incurred when the position is established. In this case, the sold call option would expire worthless and no further losses would accumulate on that end of the trade. Here, we can see that options trading with debit spreads will create scenarios where the potential for both gains and losses is limited. This is why these strategies are well-suited for options traders that are approaching the market with a conservative outlook.
Bear Put Spreads
The next type of debit spread we will cover is the Bear Put spread. As the name suggests, the Bear Put spread is utilized when an investor has a neutral to negative outlook for an asset. The strategy involves the use of put options in a simultaneous purchase and sale of two different contracts.
Let’s return to our earlier example using oil prices but now assume that we have a bearish outlook for the commodity over the next month. Here, we are going to buy one in-the-money put option (with a higher strike price) and sell an out-of-the-money put option (with a lower strike price). The underlying asset is the same, and the expiration period is the same for both assets. Bear Put trades qualify as a debit spread because a debit is incurred when the position is established. In our hypothetical example, we could establish this position by buying a 1-month oil put option with a strike price of $100 and then selling a 1-month put option with a strike price of $80. This structure can be visualized using the chart shown below:
Chart Source: Wikipedia
To achieve maximum profitability in a Bear Put spread, asset prices must close the contract period below the strike of the sold call option (this is the lower strike price of the two options contracts). If this occurs, each option will start to cancel out the other in terms of gains and losses. The early gains made on the purchased put option (at the lower strike price) will erase the losses incurred with the initial debit. Calculating this maximum profit can be done using the following steps:
- Maximum profits are realized when market prices fall below the strike price of the short put option
- Maximum profits are equal to the different the strike prices of the sold and purchased call options, less the initial debit and commissions paid for the establishing the trade.
When we look at debit spreads, we can see options trading offers unique ways of limiting potential losses. This is not something that can be said of most other types of investments. So once options traders start to understand there are many different ways of combining different types of trades into a cohesive whole, the trading toolbox expands nicely and investors have new ways of expressing their market views.
Butterfly Spreads
Credit and Debit spreads are great for options investors that have a clearly defined positive or negative stance on the market. But what types of options strategies are available for those that have a neutral outlook on an asset? There are many instances where markets will trade sideways, with no dominant trend in place. And if you believe that an asset is likely to enter into one of these periods, it makes sense to consider butterfly spreads as a strategic approach to take in the market.
Butterfly spreads offer a neutral options strategy that includes the use of both bear and bull spreads. The strategy requires four different options contracts that use the same expiration period. These four options contracts use three different strike prices, which form a price range that is used to determine profits and losses for the trade. The distance between the upper and middle strike prices should be equal to the distance between the middle and lower strike price. At the mid-point strike price, the options trader sells two contracts. At the upper and lower strike prices the options trader buys two contracts.
Butterfly strategies can utilize both call options and put options, and they can limit the total level of risk exposure that is present at any given time. In other words, traders can only lose the initial investment and maximum profits can be captured when the asset price trades near the mid-point.
Trading Example
When trading in butterfly spreads, it must be remembered that positions must use either all calls or all puts in the structure. All of the same rules apply to both types of trades, but it is not possible to mix calls and puts in the same Butterfly spreads trade. To better understand these trades we will look at a hypothetical example using call options and stocks. Let’s assume that we will buy one in-the-money call option in XYZ stock at $45 for $8, sell two at-the-money call options in XYZ stock at $50 for $5.50, and the buy another out-of-the-money call option in XYZ stock at $55 for $3.75. All of these options contracts will need to use the same expiry time. For the sake of argument, we will say that all four options contracts will expire in one month.
In combination, these trades will result in a net debit of $0.75 (5.50 + 5.50 - 8 - 3.75 = -0.75). Since options contracts trade in lots of 100 stocks, this means that the initial debit for the trade would be $75 (100 x 0.75). This initial debit would represent the total loss that is possible for the trade (along with any commission charges that are incurred for these contracts). The structure of these trades can be visualized in the chart below:
![]()
Chart Source: Wikipedia
Butterfly spreads are taken when options investors believe that the price of an asset will trade sideways to neutral over the life of the contract period. So, these are not strategies that would be useful during periods of expected volatility (ie. near the scheduled release of an important earnings report or central bank meeting). For these reasons, the maximum potential for gains would be realized if markets closed the contract period at the strike price of the middle contracts. In our example above, this would mean that maximum profits would be realized if XYZ stock trades at $50 per share one month after the four options transactions are completed.
If XYZ stock closes the contract period at $50, the in-the-money option (of $45) will close with an intrinsic value of $5. The sold options contracts at $50 would close at-the-money and expire worthless. The out-of-the-money option (of $55) would also expire worthless. With this information, we can calculate the total potential profit for the trade. Three of the options expire worthless, and the total value of the fourth contract is equal to $5 per share. This creates a profit of $500 for the trade (assuming 100 shares of XYZ stock). From this number, we must deduct the initial debit of $75 to create a final profit of $425 for the trade. We would also need to deduct any commission charges incurred in the position, but these will vary depending on the broker you choose.
Risk to Reward Benefits
When we look at this scenario from a risk to reward perspective, it starts to become clear why butterfly spread strategies are so popular and effective. In the worst case scenario, a trader using the above framework would only be putting $75 at risk at any given time. This is a relatively small amount of money when we consider the fact that the maximum gains are much higher at $425. These types of risk to reward benefits cannot be found in most other sections of the financial markets, so there are clear advantages here when traders are looking for ways to profit from static markets. It should also be remembered that it is very difficult to profit from sideways markets when using traditional “buy and hold” strategies in stocks. So, if this is your outlook for a given asset, it is a very good idea to have these techniques in your strategy toolbox so that they can be accessed then the market environment is right.
Iron Condors
The next advanced options strategy we will look at is the iron condor, which has some similarities with the butterfly spread that was explained in a previous section. When dealing with iron condors, traders will buy four individual options contracts (similar to the butterfly spread) but each options contract will be associated with a different strike price. The trade structure implements two alternate strangle trades (a long strangle and a short strangle).
Remember, strangle strategies require traders to buy or sell a put option and a call option using the same expiry time but different strike prices. Potential losses and profits are both limited when using the iron condor strategy because the second strangle is placed around the first strangle, and this offsets any additional profits or losses that might otherwise be incurred in the position. The iron condor strategy is used in cases where investors believe an asset will trade in a sideways direction, which is another similarity the strategy shares with the butterfly spread.
The main difference between these two strategies is the fact that the middle options in the butterfly spreads utilize the same strike price. Conversely, the middle options in the iron condor use different strike prices. This is an important difference because the wider area between the two middle strike prices in the iron condor creates a broader price area for traders to capture profits. In exchange for this positive, traders accept the added negative that the potential for total profits decreases at the same time.
Trading Example
To better understand the iron condor strategy, we will look at a hypothetical trading example. At its core, the iron condor is designed to increase the probability that a trade will produce gains and id implemented in market environments where volatility is low. The iron condor can also be thought of as a combined bear call spread and bull put spread.
The trade is accomplished when traders sell one out-of-the-money put option (with a lower strike price), buying another out-of-the-money put option (with an even lower strike price). At the same time, the trader will sell one out-of-the-money call (with a higher strike price) and buy another out-of-the-money call option (with an even higher strike price). So, it should be understood that all of these options are out-of-the-money and utilize the same expiration period for each contract. This positioning creates a net credit when the position is established.
Maximum gains when using the iron condor technique are equal to the net credit that is collected when the position is established. In the ideal scenario, these maximum gains will be collected when the asset price closes the contract period between the strike prices of the sold put and call options. If the asset closes the contract period with prices in this area all of the options in the trade will expire worthless — and there will be no options losses to be deducted from the initial credit that is collected when the position is opened. Calculating this maximum profit is relatively simple, and can be done using the following steps:
- Maximum profits are realized when market prices closes between the strike prices of the short put option and the short call option
- Maximum profits are equal to the net premium collected from the sold options, less the commissions paid for the purchased options.
In the reverse scenario, maximum losses occur when the asset price drops to the price of the lower put option (the purchased put option). Maximum losses can also be seen if the asset rises to the higher strike price of the pf the purchased call option. In both of these cases, losses would be equal to the difference for the put options (or the call options), less the initial credit that was collected when the trade was established originally. It should be noted that maximum losses for the iron condor strategy are much higher than the maximum potential profits. The trade-off here comes from the fact that the broader price range for profitability makes it easier for the trade to close in positive territory.
Each of these scenarios can be visualized using the structural diagram shown below:
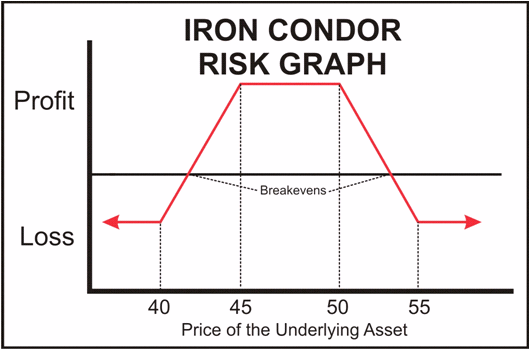
Chart Source: Wikipedia
Looking at this structural chart, we can also identify the points at which the iron condor strategy reaches its breakeven points (when no gains or losses are posted in the trade). Notice that we use the plural “points.” This is significant because there are a few different ways that the iron condor strategy can close its expiration period as a breakeven trade — not something that can be said for many other investment types. Specifically, iron condors will close at a breakeven point if asset prices rise to an area where the short call option incurs losses equal to the initial credit that is collected when the trade is opened. This can also occur if asset prices fall to the point where the gains generated by the short equal the initial credit.
Risk to Reward Benefits
With all of this in mind, it should be clear that the iron condor is one of the most complicated trades that is made available to options investors. There are also some key benefits that should be noted so that traders can determine whether or not this is a suitable strategy for your chosen investment style and approach. On the positive side, those that use the iron condor strategy tend to post more winning trades than losing trades. This is because the strategy offers a wide price range for traders to capture gains.
Another positive here is the fact that practitioners will not need to be as precise in outlining individual trades because prices will not need to reach an exact point in order to close in the black. On the negative side, the maximum potential for loss far outweighs the potential for gains. These are the opposing factors that must be weighted by those considering the use of the iron condor strategy.
Final Tips for Options Traders
Now that you have reached the end of the options tutorials, it is important to have a specific list of potential mistakes that should be avoided. Many newer traders tend to jump right in without thinking about any potential losses that might be seen later. This is why many options traders will lose an entire trading account when first starting out. Fortunately, most of these mistakes are avoidable — and when we approach the options trading environment in a conservative manner, it becomes much easier to keep a trading account alive and healthy. Here, we will look at some final trips that advanced options traders should always remember when activity positioning in these markets.
Avoid Short Time Frames
In recent years, many options brokers have started to offer a wider variety of time frames. Many now offer options contract periods that are as small as 60 seconds — and these tend to draw in newer traders with little experience and high hopes for quick riches. But the basic statistics show us that this type of approach is a recipe for disaster. The fact is that it is nearly impossible to predict what the market will do 60 seconds or five minutes in the future. And this is why these types of options contracts should be avoided in almost every case. The market is difficult enough to forecast on the broader time frames (such as one week or one month). But at least in these cases, traders are able to assess the dominant trends and make a stance that more accurately reflects what is truly happening in the options market.
Use Conservative Leverage Levels
The next avoidable mistake that is often made is to use excessive amounts of leverage. This can occur in a variety of different forms. For example some traders find themselves in losing positions and then start to look for new strategies to make up for the decline in profits. When traders add on new positions at lower or higher levels (depending on the direction of the original trade) the term “doubling-up” is often used. Although, this terminology is somewhat polite as the phrase “adding to a loser” is another that is commonly heard when this type of activity is witnessed.
Other typical mistakes can be seen when traders use too little margin in their positioning. This does create the potential for large gains but this can leave a trading account vulnerable to excessive losses if the market does not move in the right direction. For these reasons, it is always a good idea to avoid chasing quick profits and instead utilize a conservative approach that limits leverage levels reasonably.
Use an Economic Calendar
Next, we look at trader failures in using an economic calendar prior to establishing new positions in the market. It is important to remember that for any tradable asset there will always be relevant events that might cause surprise volatility in future prices. These events will change depending on the type of asset that is being traded. For example, those trading stock options or dealing with the stock benchmarks it will always be important to have a firm understanding of when major earnings reports are scheduled for release. In most cases, this will cause volatility in equities and it can be very difficult to pinpoint the direction this volatility will travel in the future. Because of this, it is generally a good idea to wait for important news events to pass before establishing positions in the market. Most of these events are scheduled well in advanced, so an economic calendar is something that should be an active part of any trader’s toolbox when real-money is being put into the market.
Focus on Liquid Assets
Another piece of advice that might seem contentious for some is that it is wise to focus mostly on liquid assets. There are many options traders that look for opportunities in assets that are less commonly traded and it is entirely possible to make money in those types of trades. But if you are looking to maintain a conservative outlook and to limit the potential for risk as much as possible, liquid assets offer the best route to take. Liquid assets are the assets that are most commonly traded. A short list of examples would include blue chip stocks, stock benchmarks around the globe, popularly traded commodities (ie. gold, silver, and oil), and the forex majors (ie. the EUR/USD, USD/JPY, USD/GBP, AUD/USD).
Always Have An Exit Strategy
Last, it is essential to have any exit strategy before any real money trade is placed. This is most important for those that are trading in American-style options as traders are allowed to close those positions before the contract expiration completes itself. No trade is ever guaranteed 100% chances for success because the market environment is always changing. This means that traders will need to prepare for the worst in all cases and plan for scenarios of action when markets do not travelled in the expected direction.
It may be that you never actually use the exit strategy — but there is nothing worse than being in the market and having no way of getting out of it. The options traders that are most successful are the ones that plan first for the worst case scenarios. The first step in accomplishing this is to determine the best way to exit a trade if the market starts to work against you.