
Futures Basics
Futures Basics – Who Trades Futures?
Futures traders generally fall into one of two categories: speculators and hedgers.
In most cases, hedgers use futures to protect their business from losses if massive price volatility is seen. These investors can lock-in favorable pricing on the materials needed to run their businesses, and this allows for more accurate revenue planning for a set period of time. Cash prices and futures valuations tend to move in tandem (positive correlation), so businesses can hedge some of their risk by taking out futures contracts in an amount equal to their expected raw materials needs.
For example, if an orange juice bottler expects a rough weather season to drive prices higher, he can use futures contracts ‘hedge’ his potential risk. Any gains/losses in his futures position should offset the gains/losses that will be seen in market prices for orange juice start to rise. Positions like these are not designed to generate significant profits from the futures positions themselves. But it is important to remember that hedgers make up a significant portion of the futures market, and the decisions they make can have a very real impact on the direction of market prices. For these reasons, it is generally a good idea to pay attention to market buzz indicating where market hedgers are putting their money.
Futures Speculators
The other section of the futures environment is comprised of investors that are not directly tied to a specific business and instead look to profit from the price volatility seen in the market. For this group of investors, futures contracts offer some key advantages when compared to other financial market investments. When compared to areas like real estate or simple ‘buy and hold’ stock strategies, profit potential is greater because prices in futures markets tend to show more volatility.
Another factor strengthening profit potential is the ability for futures investors to utilize leverage to maximize the size of their positions. Leverage is something of a double-edged sword in that the increased position sizes can also lead to magnified losses. For these reasons, it is important to use leverage in a conservative manner and only in cases where there is a higher probability that a given trade will finish in positive territory. When used correctly, leverage can be a powerful tool to enhance gains. This is helped by the fact that futures investors are not charged interest on the difference between the full contract value and the margin levels used.
It can be argued that the job of the speculator is much harder than the job of the hedger. For the most part, the hedger is simply playing both sides of the market in order to avoid adverse price shocks that could negatively influence revenue performance. But, as the old saying goes: ‘No pain, no gain.’ The speculator takes on the added risk of playing only one side of the market in order to reap the benefits of price volatility. This also means that the speculator will need to watch for changes in the market much more closely as there is little protection in place to shield against adverse price trends. Speculators will generally need to make the futures part of their daily routine whereas the hedger can ‘set and forget’ his positions knowing there is reduced risk.
Which approach is better? Fortunately (or unfortunately), the answer is neither. As is the case in most market situations, the best choice is the choice that most appropriately allows you to avoid risk and meet your investment goals. If you are looking to accumulate massive profits in the market, hedging is unlikely to meet your needs. If you are looking to protect your business and avoid adverse price shocks, speculating should be avoided. Both categories of traders can have a significant influence on the market as a whole, so it makes sense for investors to stay up-to-date on the latest market chatter to see where each group is likely to position themselves next.
Futures Basics – What is a Futures Contract?
In recent years, financial markets have started to move away from the traditional trading methods implemented floors of stock exchanges in favor of personalized platforms that can be accessed from any PC or mobile device. But while the broader environment might be changing, most of the underlying market strategies remain the same. Some of the more popular choices for individual investors include instruments like futures, options, and swaps that come in addition to the standardized ‘buy and hold’ strategies that characterize most investments.
Each of these instruments have their own advantages when taken within the context of the broader market environment. These different market approaches give investors a great deal of flexibility when we are navigating the changing daily conditions present in the financial markets. It makes sense to have a firm understanding of how each approach operates so that you can accurately choose the methods that work best for you. Here, we look at the futures contract and its potential place in your own daily trading.
Futures Contracts Defined
A futures contract is essentially an agreement between two parties to buy or sell an asset at a specific price at a later date. Most futures contracts do not involve physical delivery of the asset being traded and instead are settled in cash. This is why futures are generally thought of as speculative instruments, although there are cases where businesses might want to lock-in favorable pricing on a specific commodity in order to hedge against market volatility and fluctuating prices. Futures differ from traditional stock positions in that the holding is finite, whereas a stock can be held as long as the company is publicly traded.
As far as terminology is concerned, there is no real difference between ‘futures’ and a ‘futures contract.’ But some investors will use the term ‘futures’ to refer to the market in general while a ‘futures contract’ might be used when describing a specific trade or commodity. Futures contracts are available for all of the major asset classes, so those looking to trade stocks, indices, commodities or currencies will be able to express their market views using these contracts. Most futures contracts are monthly but can be extended if necessary using the ‘roll-over’ feature that is a part of most trading platforms.
Practical Examples
From a practical perspective, lets assume that you have made an agreement with your cable company to pay for service at a rate of $65 a month for the next year. Here you would have essentially locked-in your chosen price even if the underlying costs to produce that service were to rise during the contract period of one year.
An arrangement like this would have many similarities to a futures contract in that the buyer would set the purchase price in advance and would be protected from market volatility if the cost of producing service were to change over the contract period. In real-time market trading, investors will construct a bias in whether an asset’s price is likely to rise or fall in the future. If you believe the price of an asset will rise, you would buy a contract. If you believe the asset will fall, you will look to sell that futures contract.
For example, let’s assume the S&P 500 will rise over the next month and you buy a an S&P 500 futures contract at 1920. This is your guaranteed price for the contract expiration (similar to the $65 you paid the cable company). So, if prices rise above 1920 you will be able to cash in on the contract and pocket the difference. If prices were to fall below 1920, your losses would be equal to the difference. So if the S&P 500 were to rise during the month and finish at 1980, your position would be 60 points in the money and your profits would then be magnified by the size of your initial position.
Futures Basics – Which Assets Can I Trade?
As the financial markets continue to grow larger and more diverse, traders are seeing a widening array of options to express a market view and capitalize on asset price fluctuations as they occur. For investors that prefer to express these views using futures contracts, the choices extend to all of the major asset classes: stocks, indices, commodities, and currencies. This is important to remember because even though most traders tend to stick to a small basket of regular assets, it will be much easier to spot new opportunities in the market if you have more choices available in your trading arsenal. Here, we look at the types of assets futures traders use when establishing their positions.
Individual Stocks
Futures traders can speculate on the value of publicly traded companies, setting specific parameters for price (to buy or sell) and time (when the contracts expire). Popular examples here include stocks like Apple (AAPL), Google (GOOG), Exxon Mobil (XOM), and Bank of America Corp. (BAC). Nearly every stock that is traded on an exchange can be bought or sold using a futures contract, making it one of the most diverse asset classes available.
Those looking to speculate on stock futures will often wait for quarterly earnings releases before establishing positions as this can be one of the best indicators for where market prices are likely headed next. These releases offer key insights into the health or weakness of a specific stock, and the added managerial guidance gives investors critical information that will help define market expectations for the company. Of course, there is no need to wait for an earnings report to buy or sell. During these lower volatility periods, investors will often analyze metrics like the price-to-earnings ratio (P/E ratio), which tells investors whether or not a stock is trading at elevated or depressed levels relative to its ability to generate earnings. A lower P/E is generally considered to be positive but it could also be an indication that the broader market is expecting weakness in the stock going forward.
Benchmark Indices
A stock index is simply a collection of stocks traded on an exchange. The most popular asset in this group is the S&P 500, which is a collection of 500 companies and was designed to mirror the risk/gain characteristics present in the large-cap environment. Those trading futures contracts in a stock index will generally watch for developments in macroeconomic data releases or central bank policy. Individual stock stories (such as a significant earnings release) can still move change the direction of an index but this is less likely because those stocks are a small part of a larger whole.
Other popular choices for futures traders include the Dow Jones Industrials, the FTSE 100 in the UK, the German DAX, and the CAC in France. One of the biggest benefits to trading futures contracts in the benchmark indices is that it allows stock investors to capitalize on macroeconomic changes seen in areas like inflation, jobs, or manufacturing reports. Trading futures contracts in these areas also gives traders more flexibility to establish positions outside of the corporate earnings season.
Commodities
Commodities futures make up another popular choice, allowing investors to hedge or speculate on the market prices for raw materials. Assets like gold, silver, and oil tend to get most of the media attention but futures traders are able to extend their positions in a much broader range of areas that include industrial and agricultural commodities. In order to trade as a futures contract, a commodity must be standardized in terms of its unit measure (for example, a barrel of oil or an ounce of gold) and must be found in its raw, unprocessed state. Investor strategies for commodities futures are almost always based on macroeconomic factors, as there is no single producer in any of these areas that is capable of guiding market direction based on productivity performance.
One of the most commonly watched factors for commodities traders is the weekly oil inventory that is released by the US Energy Information Administration, which gives investors a better idea of what is happening with supply and demand trends in oil. Gold and silver traders will often look at broad market volatility and generalized risk sentiment as a gauge for determining whether to buy or sell. Additionally, trends in the US Dollar tend to influence the commodities space as a whole. This is because commodities are priced in Dollars and this creates an inversely correlated relationship between the two asset classes (when the Dollar goes up, commodities tend to drop — and vice versa.)
Currencies
World currencies can also be traded as futures contracts. The currency market is the world’s largest asset market, which means that its trends are dictated almost entirely by macroeconomic factors and central bank policy. Evidence of economic strength or weakness (as seen in reports like GDP, inflation, and employment data) tends to create the trends seen in the world’s most commonly traded currencies. These include assets like the US Dollar, Euro, British Pound, Japanese Yen. In recent years we have seen trading brokers offer more exotic options in choices like the Australian and New Zealand Dollar, Swiss Franc, and Chinese Yuan.
Investors trading futures contracts in currencies will need to pay special attention to the public statements released at central bank meetings and any announcements to raise or lower interest rates. Higher interest rates are almost always positive for a currency, as this means that investors will capture more of a yield reward for holding that currency. By contrast, any central bank decision to lower interest rates will likely be followed by a drop in valuations. These events give traders key clues when looking to establish buy or sell positions in currency futures.
Futures Basics — Oil Markets and the US Dollar
In recent years, we have seen a move toward ‘greener’ technologies. But the fact remains that the world runs on oil, and traders will continue to make money buying and selling oil futures for the foreseeable future.
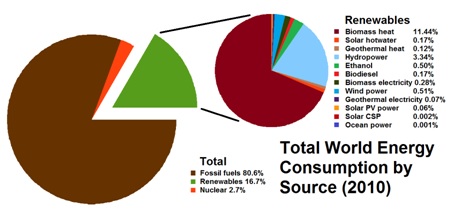
In the chart above, we can gain some perspective on these trends. As recent as 2010, more than 80% of the world’s energy came from fossil fuels. Any asset that has this much of a monopoly on energy will surely have an impact on a wide variety of assets in the financial markets. Here, we will look at some of the factors that influence oil prices and then take a look at oil’s relationship to the US Dollar.
Price Trends in Oil Futures
Trends in oil prices work much differently than what might be seen in a share of stock or in a currency. Stock prices are generally tied to the earnings seen an individual company. Currency values are tied to the economic outlook for a specific nation. None of these rules apply for oil markets, as there is no single company or country that determines where market trends are headed.
This might seem to make trading in oil futures an impossible task. But all we need to do it turn on the financial news to see that there are plenty of traders making a lot of money in these markets — so there must be some way to make accurate forecasts in oil. Specifically, price trends in oil tend to be dictated by supply/demand dynamics and the industrial productivity outlook for the world’s largest nations. Fortunately, these factors are much easier to forecast — and these are the areas watched most closely by the majority of successful oil traders.
Weather Forecasts and Economic Reports
But which economic reports are the best to watch? Weather reports tend to generate the most short-term volatility, and evidence that there will be a particularly warm summer or cold winter is something that could easily drive immediate activity higher in the price of oil futures. Other reports to watch include the Purchasing Managers’ Index (PMI), which is an indication of the rate of manufacturing expansion (or contraction) in a given area.
Of course, all countries have an influence in the amount of oil that is likely to be consumed. But most of the market’s attention is centered in the United States, China, and the Eurozone as this is where the vast majority of the world’s oil is consumed. In the US, the Energy Information Administration (EIA) releases a weekly report showing the oil stockpiles number for the period. This report is useful for making projections about the likely oil supply levels in the US, where demand projections are usually taken from industrial production reports like the PMI.
US Dollar Influence
One final factor to watch is the overall trend seen in the US Dollar. Oil is priced in Dollars, so these two assets share an inversely correlated relationship.
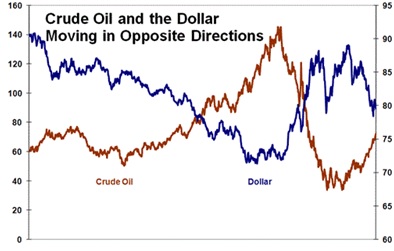
In the chart above, we can see trends in the US Dollar and oil which show this inverse relationship. Market environments that are positive for the Dollar tend to be negative for oil (and vice versa). So when we are looking at the markets from a broad perspective, positive situations for the Dollar create good opportunities to short oil. When things are looking more negative for the greenback, it might be a good idea to think about long positions in oil.
Basing oil positions on trends in the US Dollar is usually more successful from a long term perspective. This should be relatively obvious when we look at the chart above, as taking buying oil becomes profitable when the Dollar itself is in a long term downtrend. For day traders, shorter-term events like weather forecasts or fluctuations in the weekly oil supply numbers are much more pivotal. In any case, it is important to remember these correlations when active positions are taken in oil futures.
Futures Basics — Gold and Silver Markets
When we look at the historical of the financial markets, no other assets have secured a place as firm as gold and silver. Precious metals have been used as a store of value for as long as records have been kept and their popularity hasn’t faltered over time. For these reasons, it makes sense to have an understanding of how these markets operate. Rising or falling volatility in the precious metals can give significant clues for all other asset classes (stocks, indices, currencies, and bonds). So even if you plan to invest in non-precious metals assets, you should always have some sense of the underlying trends that are seen in those areas.
Gold Futures and Market Uncertainty
Gold futures tend to rise in value during times of market uncertainty, and fall during times of stability. After the 2008 global financial crisis, valuations in gold markets hit all-time highs as investors sold stocks and emerging market assets. Widespread corporate bankruptcies made investors skeptical the ability in most companies to generate stable revenues. But financial markets are deeply interconnected, and any time you take money from one place it must to into another (even if you are simply holding cash in a bank account).
In this scenario, precious metals were a key beneficiary — as gold and silver are typically described as safe haven assets that are protective in nature. As global economy data started to recover in the year following, precious metals met selling pressure as investors no longer needed the added protection.
Trading Gold Futures
In specific trading scenarios, futures traders can identify gold assets using the symbol GC. This is then followed by the month and year of the contract expiration. Each month is delineated using a different letter symbol (see below):
January: F
February: G
March: H
April: J
May: K
June: M
July: N
August: Q
September: U
October: V
November: X
December: Z
So, for example, those looking to buy a contract in gold futures that expires December 2015 would use GCZ15.
Gold/Silver Correlations
Silver futures tend to exhibit many of the same characteristics that are seen in gold. For these reasons, gold and silver share a strong positive correlation from the historical perspective.
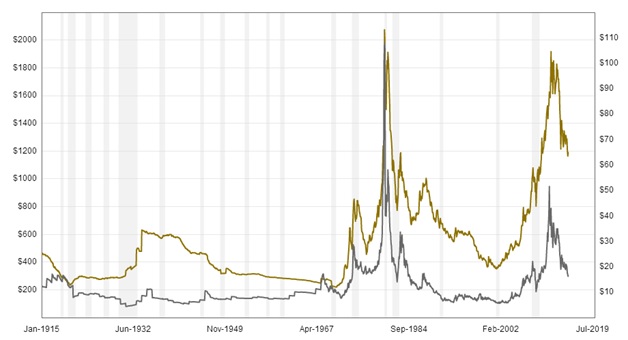
The chart above shows the correlation between gold and silver prices over the last 100 years. Clearly, some discrepancies exist. But the underlying trends here are very clear and it should be obvious to futures traders that market environments favorable for one asset will likely be favorable for the other. When precious metals markets are falling (and financial uncertainty is being reduced), gold and silver will likely meet selling pressure.
Trading Silver Futures
This is valuable information for those looking to trade silver futures. Gold is often the leading indicator of the dominant trend in precious metals (as it is more commonly traded). So when silver traders start to see price changes in gold, it becomes much easier to start committing to positions in silver. It should be remembered that these are different commodities, so there will be supply/demand dynamics that can influence one metal and not the other.
Silver, for example, is a harder metal with more practical applications in the industrial sphere. But when we look at the long-term historical correlations, both assets tend to perform in similar ways given the financial environment in place at any given time. In real-time trading, silver futures follow the same standards as gold but instead start with the symbol SI. If you wanted to buy a silver futures contract with a December 2015 expiration, the traded futures symbol would be SIZ15.
Futures Basics — Chart Types in Technical Analysis
For those getting started in futures, technical analysis strategies can be some of the most daunting things you will need to learn. But, as with anything, it is all about pacing yourself — and the first factor you need to understand is the chart itself. There are four main types of price charts — the line chart, the bar chart, the point and figure chart, and the candlestick chart.
Some of these charts are used less often than others but each has its own place and time — so it is a good idea to understand how each chart plots price. This way, you will be able to understand analysis posts made by other traders and determine which chart type works best for you. Here we will look at how each chart type interprets and displays the same price data so that we can see some of the differences in each layout.
Line Charts
First, we look at the most basic chart — the line chart. These charts are plotted as a simple line with each price value based on the closing price for the time period. On the X-axis we have our time values, on the Y-axis we have our price values: This is a convention followed with each of the main chart types.
For line charts, the most important thing to remember is that the price value show represents the closing price value for that interval. So, if you are using a 5-minute chart the price you see is the final price for that 5-minute period (not the opening price value or the average price value of the period). This is course, is the default setting for most charts so if you would rather see the opening or average values for the period, you will generally need to adjust your settings. Most traders stay with the default setting and simply use the closing values.
Practical Application: Line charts are great for getting a quick view of where prices have traveled over a given time. The downside is that information like the high and low for the period is not visible. The closing price is often considered most important in an interval, however. So there is value in using line charts.
Bar Charts
In terms of complexity, the next in line is that bar chart, which adds a few more data points to the layout. Each interval in the bar chart is shown as a vertical line. The top of this line marks the high for the interval, while the bottom of each line marks the low. There are also two horizontal dashes on each side of the vertical lines. The left side dash shows the opening price value for the period, while the right side dash shows the closing price value for the period:
Most charting stations will separate bullish and bearish intervals by color. In the example above, the green bars show that the closing price in the interval was higher than the opening price. Red candles show that the closing price for the interval was lower than the opening price. A third color is often used to show instances where the opening price value is equal to the close. In the chart above, these intervals are shown in blue.
Practical Application: Bar charts show more price points than line charts. This makes bar charts more useful in setting stop losses and profit targets as they show all included price activity in the interval.
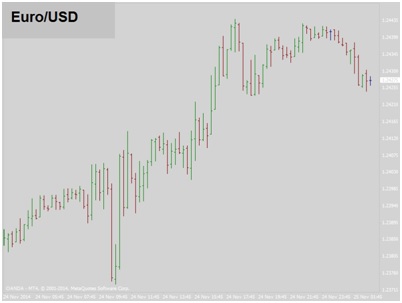
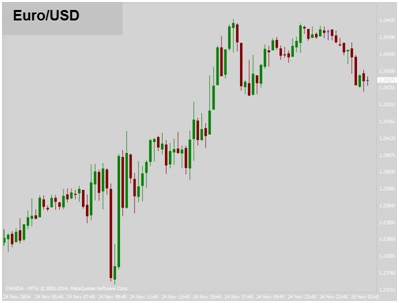
Candlestick Charts
Candlestick charts include most of the same information seen in bar charts. But since the ‘bodies’ of each candlestick interval is filled in, it becomes much easier to spot trends in price at a quick glance.
If we understand the elements of a bar chart, we can understand the elements of a candlestick charts – but the terms differ. Each interval on a candlestick chart is made up of a candle ‘body,’ a lower ‘wick,’ and an upper ‘wick.’ The lower wick represents the lowest price seen during that interval, while the upper wick represents the highest price for that interval.
The opening and closing values depend on the color of the candle. In this chart example, we used green for intervals where the close is higher than the open (a bullish candle). We used red for intervals where the open is higher than the close (a bearish candle). Traders can use any color convention they choose but it is generally a good idea to use the same color scheme in all of your trading as this helps to avoid confusion.
Practical Application: Candlestick charts have become the most commonly used charting format for futures traders. This is because it is very easy to identify whether most of the price action in a given interval is bullish or bearish (based on the color of the candlesticks themselves). These charts are great for spotting trends and reversals, and for generating candlestick patterns (which will be the topic of another tutorial).
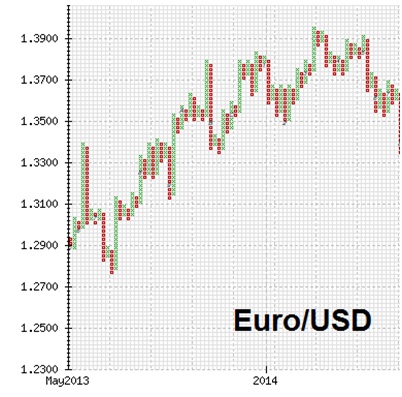
Point and Figure Charts
Last, we look at the point and figure chart, which has become less common with the increased implementation of computer-based technical analysis. Point and figure charts are not encountered very often but we will look at them here so that they are easier to understand if seen.
Point and figure charts have a long history in the financial markets, but focus less on time and volume when compared to the other chart types. This can be helpful in removing some of the external ‘noise’ for traders that want to focus more directly on the price moves themselves.
In the example above, we can see that the chart is plotted using Xs and Os in a grid format. In bullish (upward price moves) price is plotted with an X, while bearish price moves are plotted with an O. These Xs and Os are placed in boxes on the chart. Each box represents a value on the price scale but this value will adjust over change (as market valuations change).
Practical Application: Since these price values are not standardized, any movements on the chart are best viewed from a relative perspective. When prices start to change in trend, the markers shift one place to the right — so this type of chart is also useful for traders that are looking to trade price reversals. Point and figure are much less common in today’s trading but they can be helpful when traders are looking to focus on price action rather than outside factors like trading volume.
Bottom Line
Each chart type has its advantages and disadvantages, depending on which type of strategy you are using and the amount of price information you need to see at any given time. It is important to understand how all types of charts plot price because this can help you to avoid making trading mistakes in your futures positions. Once you have an understanding of each chart type, you are ready to start conducting technical analysis and identifying chart patterns that can be used to establish new positions.
Futures Basics – Buying, Selling, and Spreads
In order to successfully profit from active positioning in the futures market, investors must accurately forecast where asset prices are heading. But this does not mean that as asset’s value must increase in order for your position to make gains. In fact, many positions in the futures markets benefit from falling asset prices. These are referred to as short-selling positions, or shorts. Here, we look at the differences between buying and selling strategies that are commonly found in the futures market. We also look at spreads, as an approach for those with a more conservative mindset.
Long Positions
When a futures trader believes that the price of an asset is likely to rise, it makes sense to consider entering into a long position. This approach is similar to the traditional ‘buy and hold’ strategies that are commonly seen in stock markets. Here, a futures trader buys an asset at one price and looks to sell it back to the broker at a higher price some time later. The difference between this purchase and sale price marks the total profit or loss in the position.
In terms of strategy, long positions are generally based on a bullish outlook that supports an argument for higher prices at a later date. This outlook will depend on different factors depending on which type of asset is being traded. For example, those trading oil futures might wait for inventory stockpile reports that show supply constraints before going long. Decreased supply levels tend to drive prices higher, so market changes like this would inspire many traders to buy the asset in anticipation of a rally.
Short Positions
When a futures trader believes that the price of an asset is likely to fall, it makes sense to consider entering into a short position. With this approach, a futures trader will effectively ‘sell’ an asset at one price and then buy it back from the broker at a later date. If the asset price falls during the time the position is held, the trader profits. The difference between the initial sale price and the later purchase price marks the total profit or loss in the position.
Short positions are generally based on a bearish outlook that supports an argument for lower prices at a later date. This outlook will depend on different factors depending on which type of asset is being traded. For example, those trading currency futures might wait for deteriorating macroeconomic data or indications that a central bank is likely to reduce interest rates. Lower interest interest rates diminish the yield value for those holding long positions, so many of those traders will flip that stance if these conditions change. This can help drive asset prices lower over time.
Spreads
Another approach that is less often discussed is the use of spreads. With this strategy, investors will look to capitalize on price differences in two different futures contracts in the same asset. Many consider this approach to be much safer than trading ‘naked’ futures contracts in singular long or short positions. This makes spread trading preferable for those with a more conservative outlook.
Spreads trading in futures contracts can be done in a few different ways. In an Inter-Exchange Spread, an investor will take a position in two different futures exchanges. For example, we might look at the Financial Futures and Options Exchange (LIFFE) and the Chicago Board of Trade (CBOT) — and see price discrepancies. A trader could buy the cheaper contract and sell the more expensive contract, pocketing the difference in the process. In a Calendar Spread, traders will buy and sell two different futures contracts in the same asset but with different expiration times. This type of strategy works best when traders are expecting the asset to show increased volatility over time.
In an Inter-Market Spread, a trader will use contracts with the same expiration period but in different assets. This type of trade skill qualifies as a spread because the trader is looking to capitalize on the price differences likely to be seen between contracts. An example here could include something like a Long December Gold contract and a Short December Silver contract. This type of strategy works best when a trader expects there to be significant price differences between two different assets prior to the expiration period.